Environmental Management
- Daifuku Group Environmental Policy
- Daifuku Environmental Vision 2050
- Promotion System
- Responding to Water Risks
- Life Cycle Assessment (LCA)
Daifuku Group Environmental Policy
Basic Approach
The Daifuku Group will contribute to the creation of a sustainable society by engaging in sound business practices in accordance with our company creed, management philosophy, and Group Code of Conduct. Each and every employee shall be aware of the environmental impact of all aspects of our business activities, including the development, design, production, sales, installation, and after-sales service of material handling systems and equipment, and shall strive to minimize the impact of such activities.
Basic Policy
We will ensure that all Group officers and employees are aware of this policy and work to resolve environmental issues throughout the supply chain.
- Compliance with laws and regulations
- We will comply with social rules, including laws, regulations, and agreements related to environmental conservation, in the countries and regions where we operate.
- Building and operating an environmental management system
- We will set environmental targets and establish an environmental management system. The operation of the system will be reviewed periodically for continuous improvement.
- Addressing climate change
- We will provide products and services that contribute to improving energy efficiency. We will also minimize greenhouse gas emissions in all aspects of our business activities, including throughout the supply chain.
- Sustainable resource use
- We will strive to use resources sustainably and efficiently at every stage from product development and design to production, use, and disposal, while also working toward the reduction of waste emissions, reusing, and recycling.
- Consideration for nature and ecosystems
- We will prevent air, water, and soil pollution through the reduction and correct treatment of hazardous substances while also contributing to the preservation of ecosystems and biodiversity.
- Collaborating with suppliers and business partners
- We will prioritize the procurement and purchase of materials, parts, and products with lower environmental impact. Additionally, by providing guidance and support to suppliers and business partners as needed, we will strengthen our collaboration and work toward reducing our impact on the environment.
- Environmental education and awareness
- We will provide educational and awareness-raising activities to raise environmental awareness among all Group executives and employees and to enable each individual to act autonomously.
- Information disclosure and communication
- We will strive to regularly disclose information on the progress of our initiatives and emphasize communication with stakeholders to resolve environmental issues.
Established: August 31, 2023
Daifuku Environmental Vision 2050
The Group’s automated technology, with material handling at its core, contributes extensively to factory automation in general industries, semiconductors, and automobiles, as well as to labor saving in logistics centers and more efficient airport operations. As part of the supply chains in a variety of industries around the world, the Group recognizes that, in order to realize a sustainable society, it is essential to understand the positive and negative environmental impacts of our business activities, products, and services, as well as work toward improving the value we provide and minimizing our burden on the environment. In addition, in order to further enhance our corporate value, we must develop and implement mid- to long-term strategies while taking into consideration the opportunities and risks that global environmental changes which have already manifested may present to the Group.
Given these circumstances, in addition to fulfilling our responsibilities as a corporation, the Daifuku Group believes that it is necessary to take more concrete actions at a higher standard to realize the future society we aim to create. As such, in May 2023, we revised the Daifuku Environmental Vision 2050 that was announced in 2021, expanding our crucial issue areas and raising our environmental targets for 2030.
The Group aims to realize this Vision by addressing environmental issues throughout the entire supply chain while engaging in dialogue with customers, suppliers, investors, and other stakeholders.
Daifuku Environmental Vision 2050 (revised; announced May 2023) (PDF: 740KB)
Daifuku Environmental Vision 2050 (pre-revision; announced February 2021) (PDF: 335KB)
- *Clicking on the image will open a new window.
- *Natural capital refers to the natural stock of resources (plants, animals, air, water, soil, minerals, etc.) that combine to yield benefits to people. Businesses and society are expected to use this capital in a sustainable manner. Although these resources are being eroded by climate change, improving their sustainability will lead to the absorption of greenhouse gases and the mitigation of natural disasters.
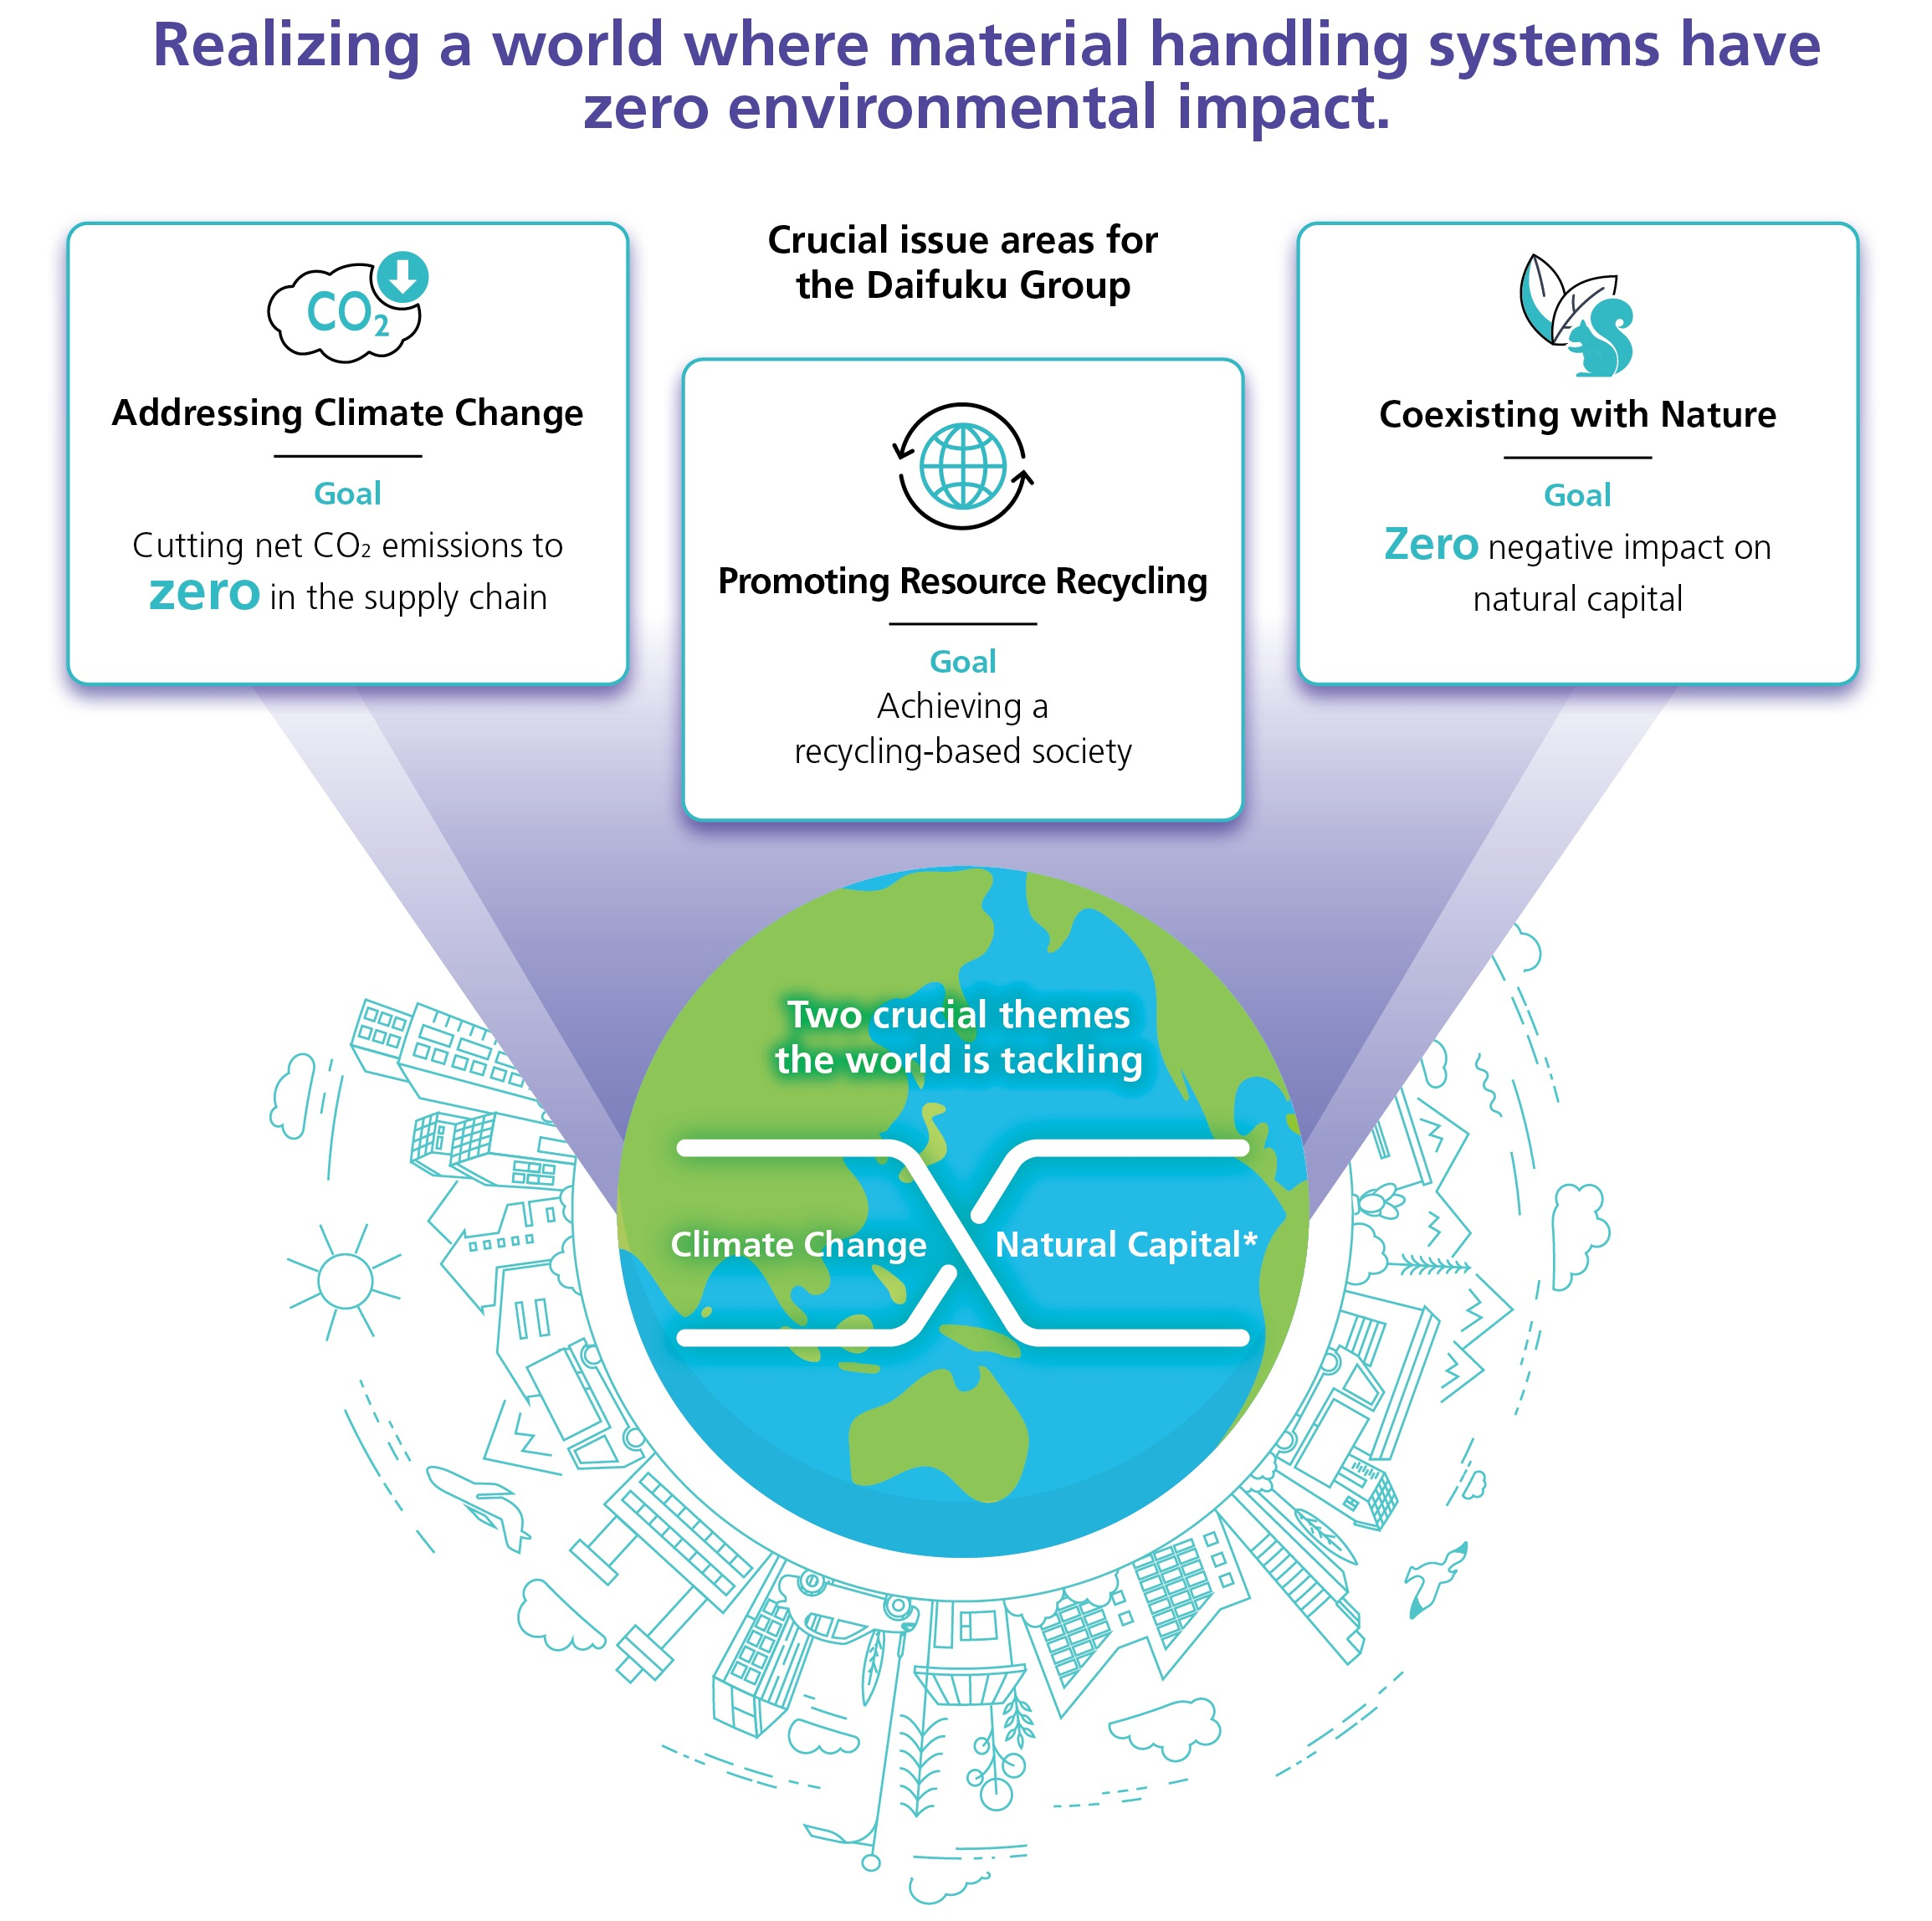
Three crucial issue areas
Ensuring a healthy global environment is an essential prerequisite to creating a world where all people can lead fulfilling lives. Thus, under our management philosophy “Automation that Inspires,” addressing climate change and other environmental challenges is a crucial management issue. The Daifuku Group will fulfill its responsibilities as a corporate partner throughout the entire supply chain and will strive to realize this Vision with a view to the future society we wish to create.
Addressing Climate Change
Goal: Cutting net CO2 emissions to zero in the supply chain
We will reduce net CO2 emissions from our business operations throughout our supply chain to zero by developing and providing products and services that contribute to the creation of a decarbonized society, using energy efficiently and introducing renewable energy at our Group sites and suppliers.
Promoting Resource Recycling
Goal: Achieving a recycling-based society
We will endeavor to reduce the amount of water and other resources we use. We will also contribute to the formation of a recycling-based society by extending the service life of our products, minimizing the amount of waste generated at our production sites, and expanding the recycling of used products and parts.
Coexisting with Nature
Goal: Zero negative impact on natural capital
We will strive to sustainably use ecosystem services and conserve biodiversity based on an understanding of the impact of our business activities on the global environment. We will minimize negative impacts on natural capital such as air, water, and soil, and, together with our stakeholders, coexist in harmony with nature.
Environmental goals for 2030
In revising this Vision, we also reviewed our targets for 2030, setting a new CO2 emissions reduction target to help achieve the 1.5°C global warming limit required by the Paris Agreement,*1 and setting new targets for water resources, biodiversity conservation, and awareness-raising activities. In order to respond to constantly changing social trends and the business environment, we will periodically review our targets and adjust them as necessary. The results for fiscal 2022 have been disclosed based on the KPIs from prior to revision. From fiscal 2023 onward, targets will be managed using the KPIs below.
In May 2024, regarding one of our critical issue areas, addressing climate change, we have upwardly revised our 2030 Scope 1 and Scope 2 reduction targets (compared to FY2018) from 50.4% to 60%. In addition, we have set a new target for the percentage of electricity derived from renewable energy sources. Also, with regard to coexisting with nature, to emphasize more effective awareness-building throughout the Group through the Sustainability Action Program,*2 we have revised the target from number of participants to a qualitative goal.
- *1The targets for 2030 have received official approval from the Science Based Targets initiative (SBTi) and include a 1.5°C aligned target for Scopes 1 and 2 and a well-below 2°C aligned target for Scope 3 (Categories 1 and 11).
- *2Daifuku’s unique program for sustainability awareness and training
| Crucial issue areas | KPIs | Targets |
|---|---|---|
| Addressing Climate Change | Daifuku CO2 emissions (Scopes 1 + 2) | 60% reduction (compared to FY2018) |
| Percentage of electricity derived from renewable energy sources | 80% | |
| CO2 emissions from purchased goods and services (Scope 3 Category 1) |
30% reduction*1 (compared to FY2018) |
|
| CO2 emissions from the use of sold products (Scope 3 Category 11) |
||
| Promoting Resource Recycling | Landfill disposal rate | Less than 1% |
| Water use intensity*2 | 60% reduction*3 (compared to FY2018) |
|
| Coexisting with Nature | Rate of implementation of biodiversity conservation activities at major sites*4 | 100% |
| Global expansion of Sustainability Action | Program expansion and awareness raising |
- *1Scope 3 Category 1 and Category 11 combined target
- *2Water consumption (1,000 m3) divided by net sales (100 million yen)
- *3Upwardly revised as initial target was met ahead of schedule (August 2024)
- *4Sites with 100 or more employees
Promotion System
We have organized a group-wide Sustainability Promotion Committee chaired by the President and CEO, with members including the corporate function heads, global business heads, and Group Chief Officers. Under its umbrella, the Environmental Management Subcommittee has been established. Focusing on the crucial issue areas set in the Daifuku Environmental Vision 2050, this subcommittee promotes activities and confirms progress toward targets. In fiscal 2026, we launched the following three projects to further discussions on each theme across our business units and Corporate Functions departments.
Please enlarge the screen to view
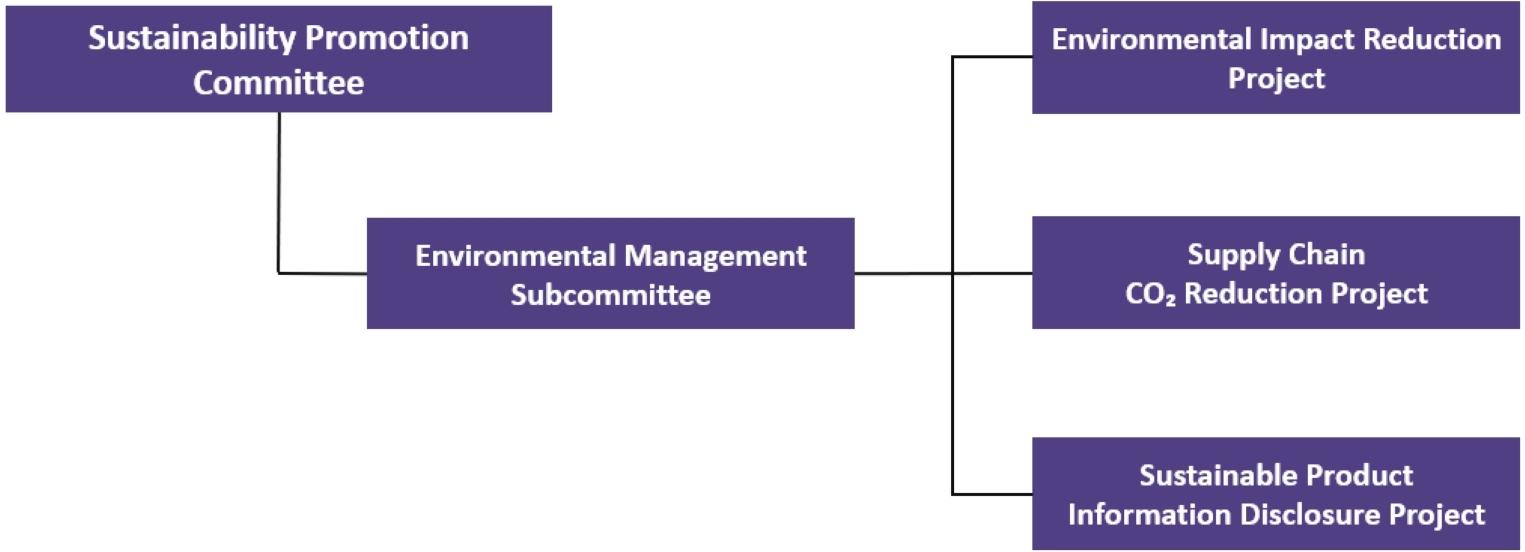
Environmental Management Subcommittee
| Members | Business units (manufacturing, procurement, and design departments), Contec Co., Ltd., Production Innovation Division, Human Resources and General Affairs Division, Legal Department, Governance Promotion Department, DX Division, Sustainability Promotion Department | |
|---|---|---|
| Main agenda | Environmental Impact Reduction Project | Consider the introduction of energy conservation and renewable energy within and outside of Japan; promote resource conservation activities |
| CO2 Emissions Reduction Program | Work with suppliers to decarbonize the upstream supply chain | |
| Sustainable Product Information Disclosure Project | Establish common internal rules and definitions for responding to requests from stakeholders regarding our products | |
Environmental management system certification
We promote ISO 14001 international standards for environmental management systems certification at all primary production sites both within and outside of Japan. All three of our Japan production locations as well as 19 of our production locations outside of Japan have been ISO certified. 92% of our production facilities have obtained certification.
| Certification standards | Production sites (consolidated) | Number of certified locations | Proportion of certified locations |
|---|---|---|---|
| ISO 14001 | 24 | 22 | 92% |
Environmental audits
In order to confirm the consistency of the environmental management system, regular audits are conducted at sites with ISO certification.
| Type of audit | Frequency and content | Subject |
|---|---|---|
| Internal audits | Conduct internal audits by in-house auditors at least once per year | Sites with ISO 14001 certification |
| External audits | Undergo an audit by a certifying body once per year |
Responding to Water Risks
The Daifuku Group uses Aqueduct, an assessment tool developed by the World Resources Institute (WRI), to regularly assess water risks in countries and regions where we hold major operations (Japan, China, Taiwan, India, Thailand, South Korea, the United States, and the United Kingdom). In the analysis conducted in 2025, it was found that three sites in India and three sites in China are located in high-risk regions (water risk level of "high" or above). These sites were set as priority locations, and field surveys were conducted at each of them. In the results, it was found that the total water intake amount at the six sites in fiscal 2025 was 21,449m3. The main use of water at all five sites was found to be employees’ daily use and watering plants, and the supply and quality of water from intake sources were stable. As such, no major risks have been identified at this time, but we are working to reduce water usage through measures such as conserving water in offices and reusing treated wastewater.
The Group’s main use of water in our production activities is the degreasing process prior to product coating, but this process does not require high quality or a large amount of water. However, we recognize that water is an important resource for Daifuku, and we will continue to implement appropriate measures related to water risks based on an understanding of the water usage at our production sites.
The results of the water risk assessment (overall water risk*) for our main sites are as follows.
| Water risk level | Number of sites |
|---|---|
| Low (0-1) | 3 |
| Low-medium (1-2) | 15 |
| Medium-high (2-3) | 4 |
| High (3-4) | 3 (China) |
| Extremely high (4-5) | 3 (India) |
- *A comprehensive water-related risk assessment, as defined by Aqueduct, based on all factors including physical water quantity, water quality, regulatory and reputational risk.
Life Cycle Assessment (LCA)
Daifuku conducts environmental impact assessments of all of the products we develop using an LCA method in order to determine the environmental footprint of our products throughout their life cycle and to continuously develop environmentally conscious products. Comparing our new products to older models helps us to enhance the environmentally friendly design of our products and services.
Case StudyLCA results for the Mini Load Automated Storage and Retrieval System (Mini Load AS/RS, H-P10)
The Mini Load AS/RS is a product that automatically receives, stores, and retrieves small quantities of various irregularly-shaped products and parts in containers, cardboard boxes, or trays. The H-P10 is a high-capacity model suitable for multi-tenant distribution warehouses, and the lightweight main unit and specialized transfer machine reduce the amount of time required for storage and retrieval.
1. LCA calculation range
Please enlarge the screen to view
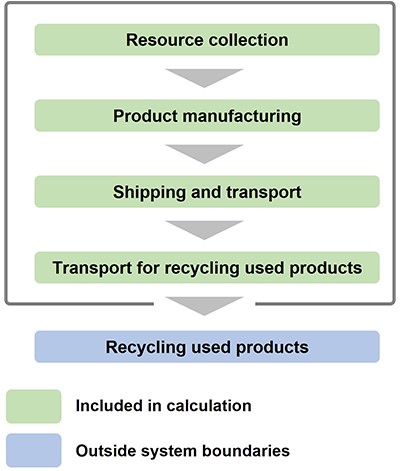
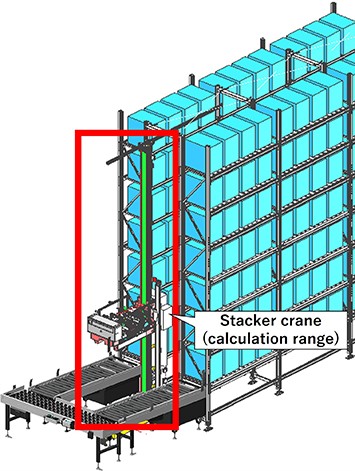
For the portion of the stacker crane that makes up the H-P10, we calculated the receiving and retrieving operations for 12 years within the range of resource collection to transport for recycling used products.
2. Impact assessment
Impact assessments were conducted by life cycle stage for each of the six impact areas shown in the graph below. We also compared new and old products by impact area.
Results of impact assessments by life cycle stage
Please enlarge the screen to view
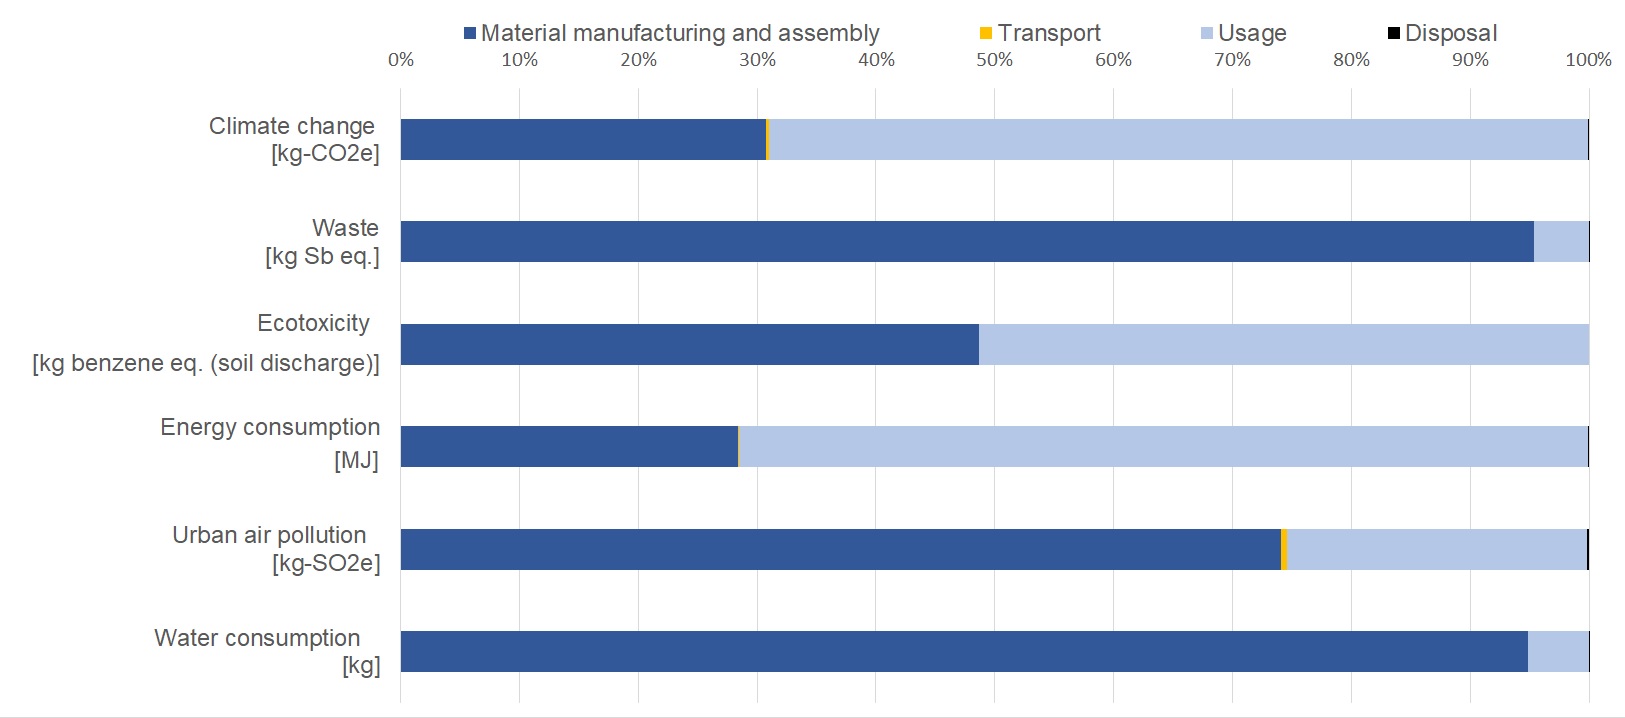
- For waste and water consumption, the material manufacturing and assembly stage accounted for more than 90% of the impact.
- For climate change and energy consumption, the usage phase accounted for about 70% of the impact.
- In all areas studied, the impact from the transport and disposal phases was found to be low.
Comparison of CO2 emissions (impact area: climate change)
Please enlarge the screen to view
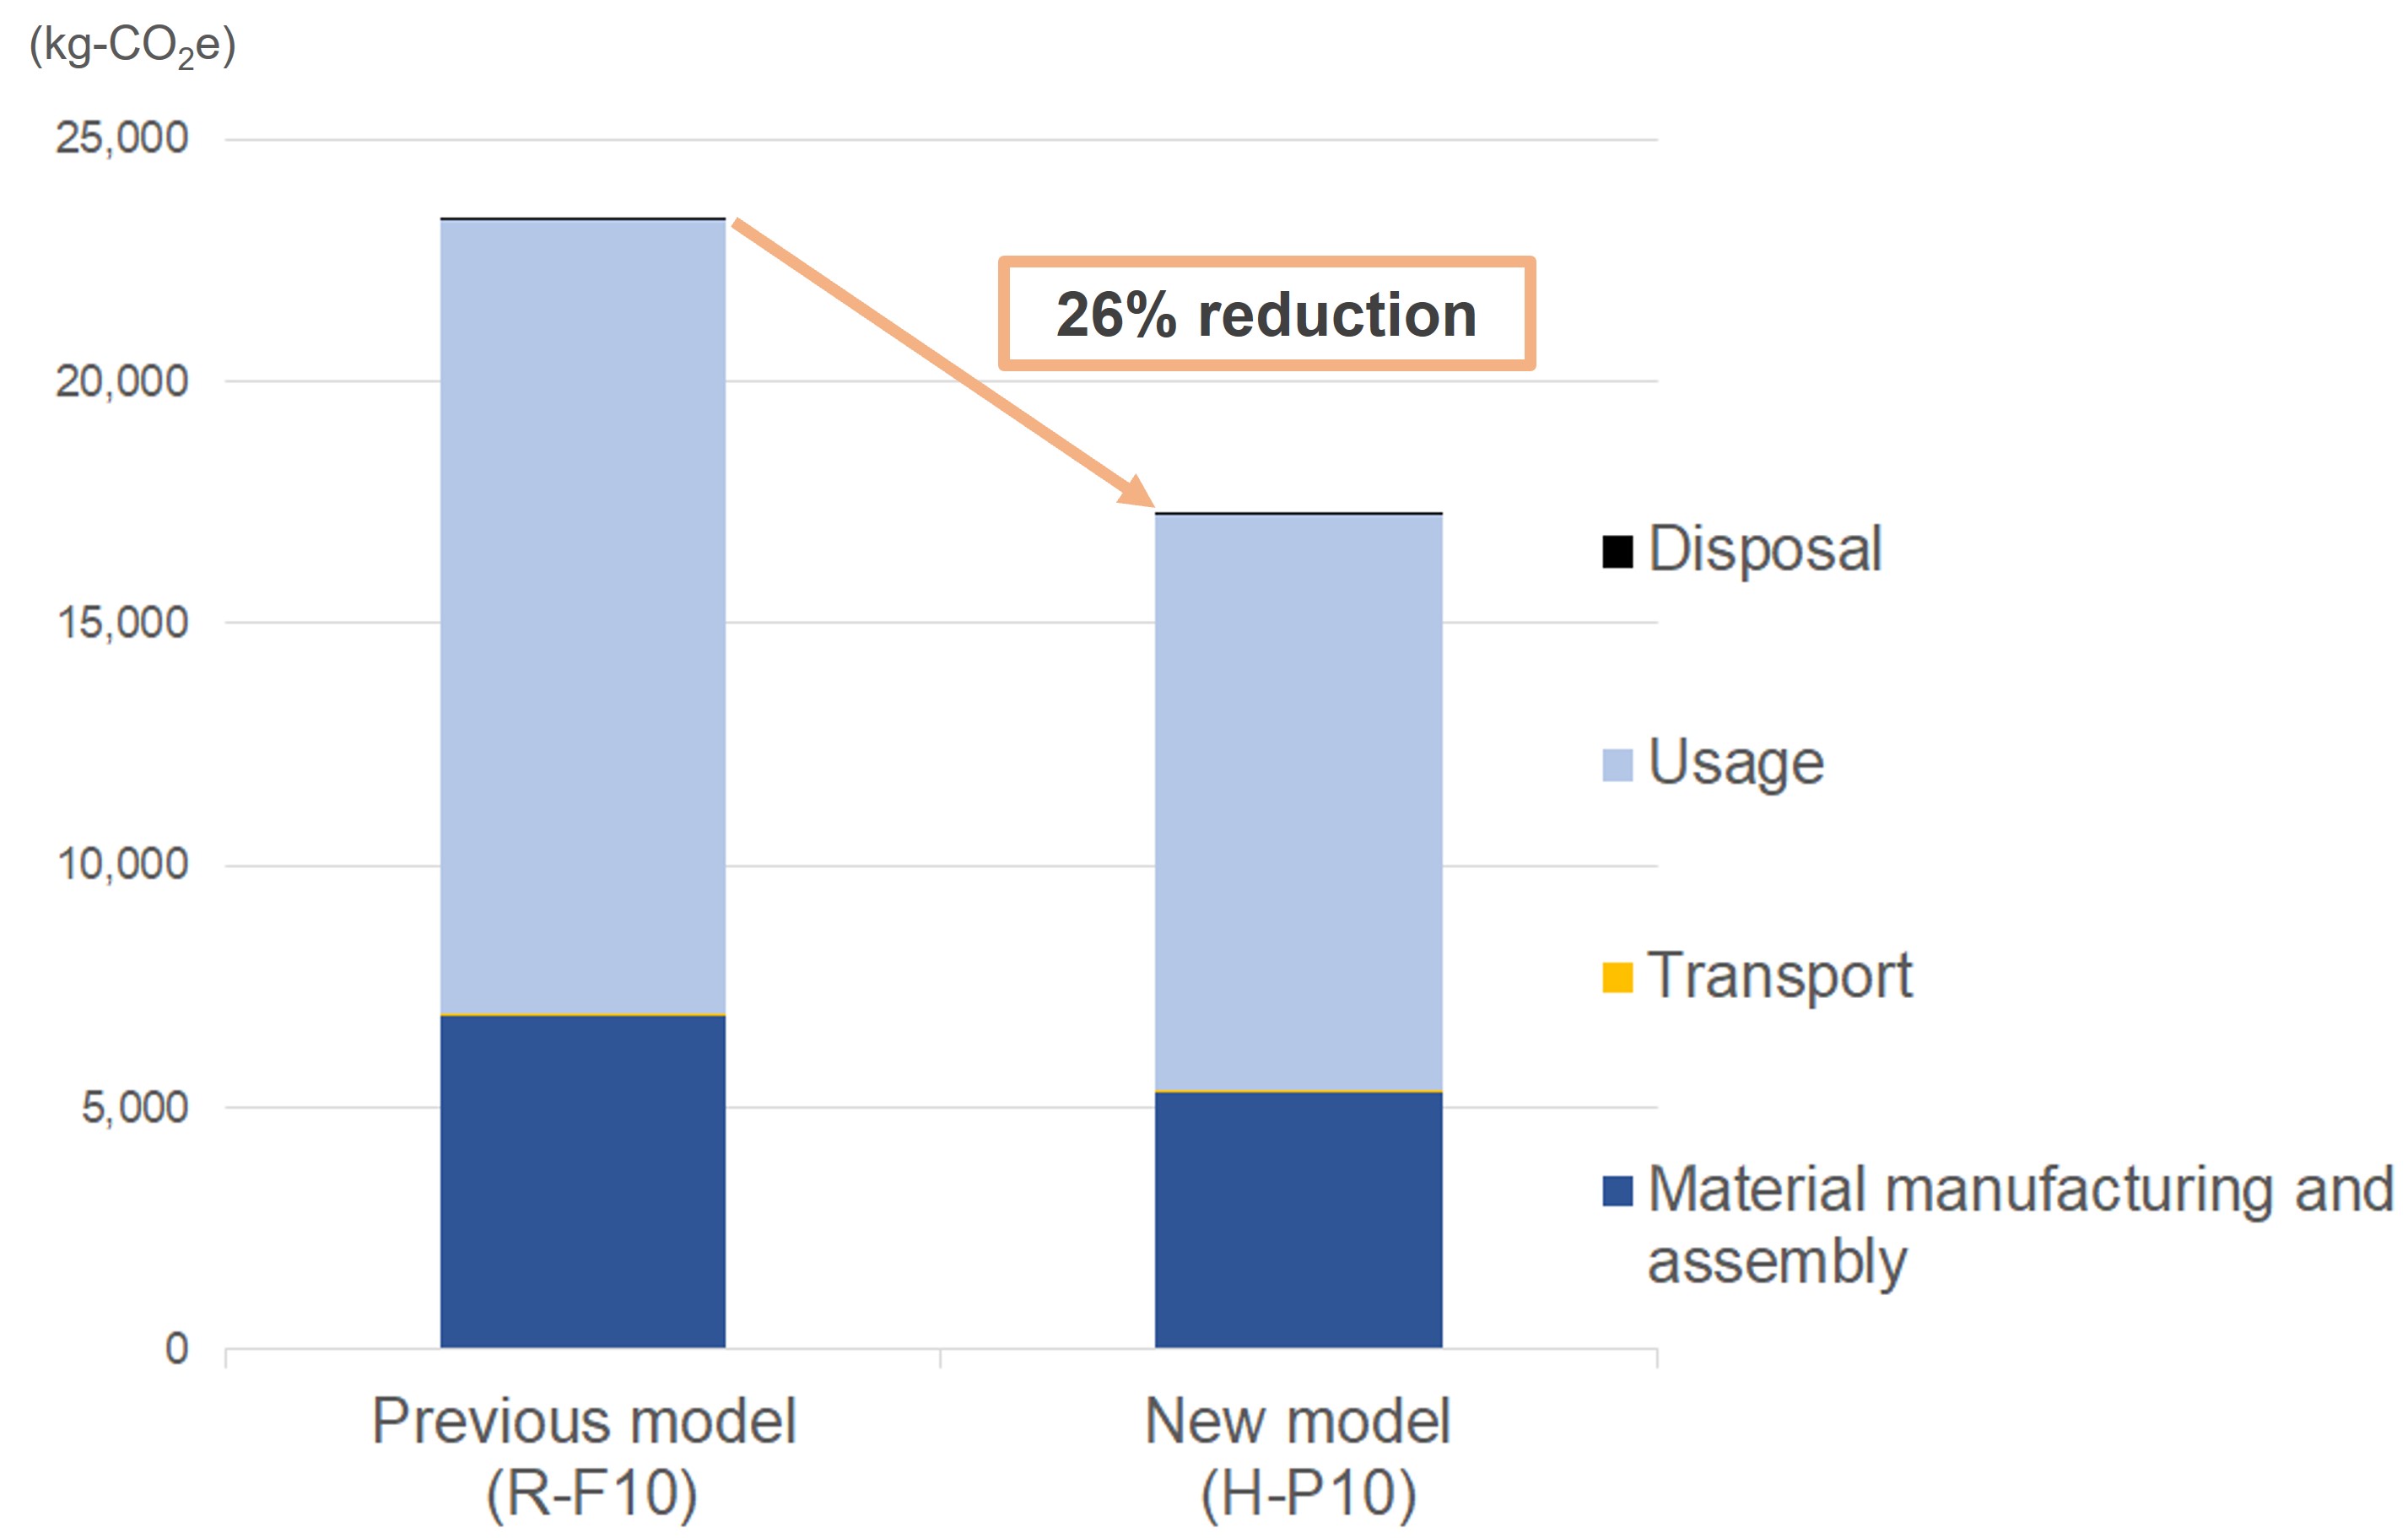
The H-P10 emits 26% less CO2 than the previous model (R-F10) due to reductions in raw materials, the number of parts, and power consumption during use.