Climate Change
- Basic Approach
- Disclosures Based on TCFD Recommendations
- Major Initiatives
- Participation in Climate-Related Initiatives
Basic Approach
The Daifuku Group supports the Paris Agreement, the Act on Promotion of Global Warming Countermeasures, the Act on the Rational Use of Energy, and other laws and regulations related to climate change, and we are advancing our environmental management to help create a decarbonized society and realize SDGs. We are actively working to reduce our energy consumption and contribute to the environment through manufacturing, and we file regular reports with the government on our energy consumption, CO2 emissions, and other data.
The Daifuku Environmental Vision 2050 establishes addressing climate change as one of our critical issue areas, and we are focused on reducing CO2 emissions through our products and services, reducing CO2 emissions throughout our entire supply chain, and introducing renewable energy. We will continue to endeavor to improve our business activities as well as our products and services through dialogue with our stakeholders, contribute to the development of society, and increase our corporate value.
Disclosures Based on TCFD Recommendations
In May 2019, Daifuku expressed its support for the TCFD (Task Force on Climate-related Financial Disclosures) recommendations. Information is disclosed in accordance with the core elements of the TCFD recommendations for climate-related financial disclosure: governance, strategy, risk management, and indicators and targets. In fiscal 2023, we conducted an additional financial impact assessment and scenario analyses, and we updated our disclosures in fiscal 2024.
Governance
Please enlarge the screen to view
Supervision and execution system for climate-related risks and opportunities
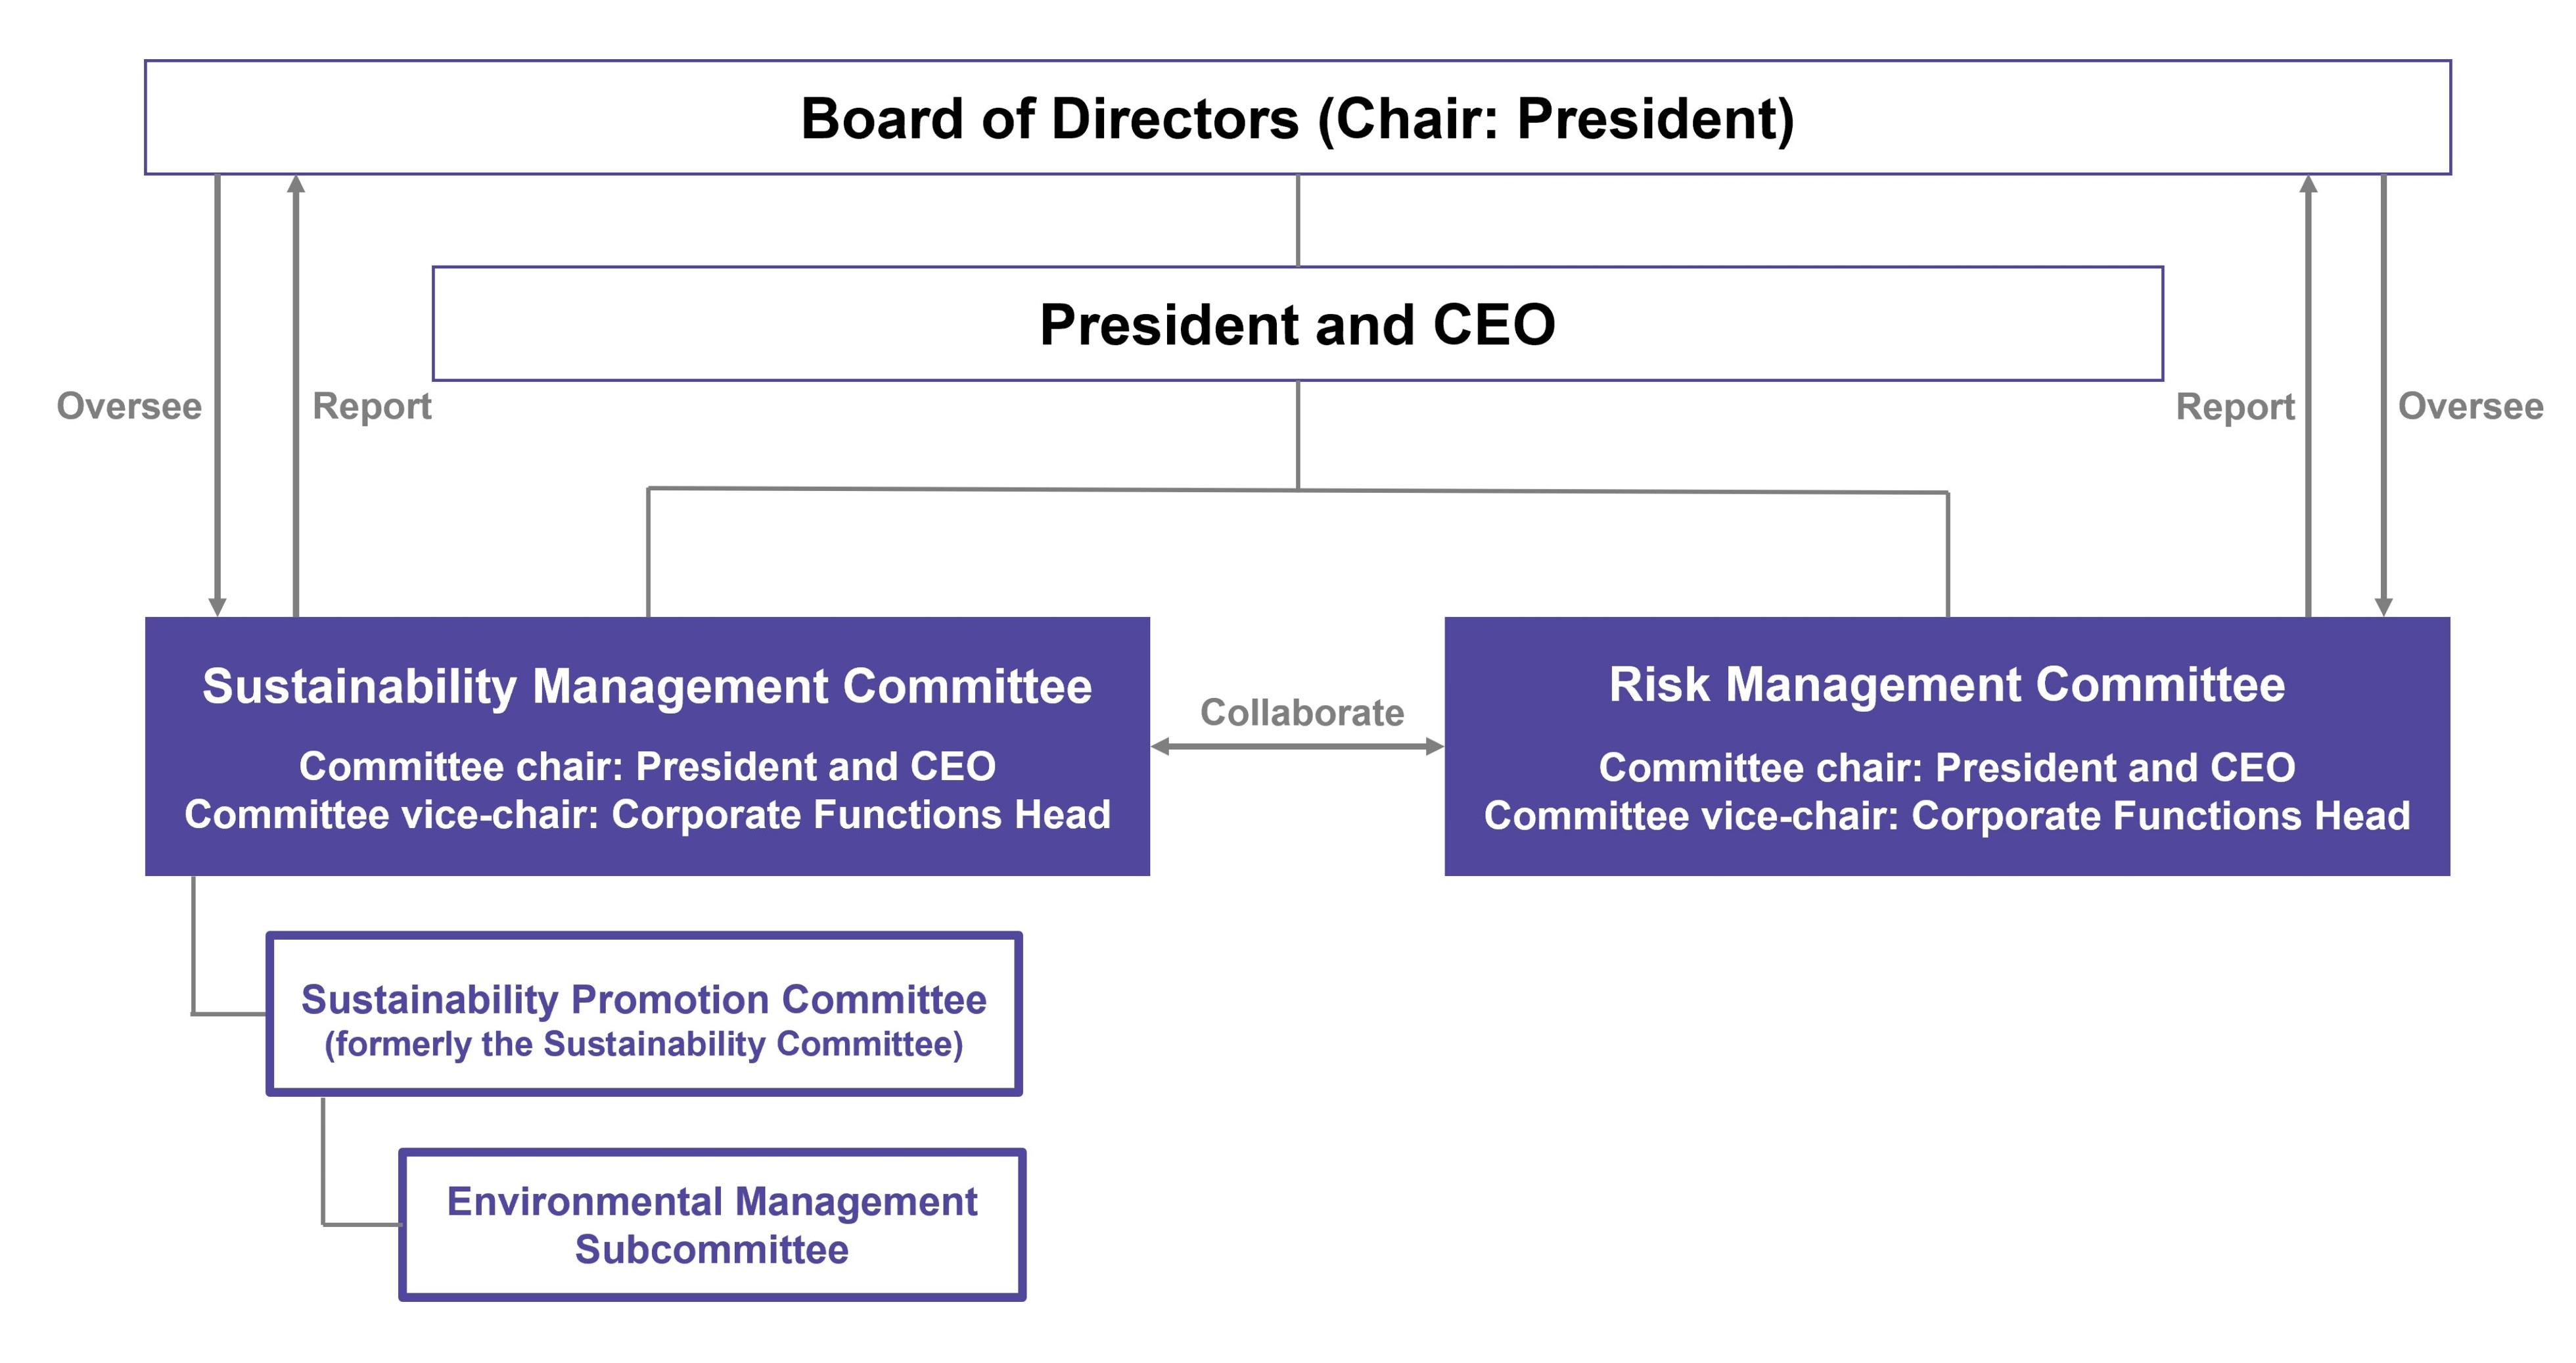
The Board of Directors oversees initiatives to enhance corporate value over the medium to long term, including management strategies to address climate-related risks and opportunities. Within the Board of Directors, the President and CEO (and COO) is responsible for overseeing climate-related risks and opportunities. Through training, opinion exchanges with experts, and dialogue with customers, the members of the Board of Directors are enhancing their insight into sustainability issues, including climate-related issues, in order to improve their skills and competencies to oversee the Group’s initiatives.
Additionally, we have established the Sustainability Management Committee, which reports on and submits critical matters regarding sustainability issues, including climate-related issues, to the Board of Directors. This committee engages in important discussions regarding management strategies that emphasize the enhancement of corporate value over the medium to long term, as well as the confirmation of the progress and results of plans. Furthermore, the Sustainability Promotion Committee and the Environmental Management Subcommittee, under the jurisdiction of and in cooperation with the Sustainability Management Committee, are responsible for investigating and implementing more concrete measures based in management strategies on a practical level.
Role of each organization
| Members | Role | |
|---|---|---|
| Board of Directors | Chair: President and CEO Members: Chairman, Directors (2 inside, 5 outside) |
|
| Sustainability Management Committee | Chair: President and CEO Members: Corporate Functions Head, Global Business Heads, C-suite, etc. |
|
| Risk Management Committee | Chair: President and CEO Members: Corporate Functions Head, Global Business Heads, C-suite, etc. |
|
| Sustainability Promotion Committee | Chair: President and CEO Members: Corporate Functions Head, Global Business Heads, C-suite, etc. |
|
| Environmental Management Subcommittee | Leader: director or officer appointed according to theme Members: employees appointed by each global business and Corporate Functions |
|
Monitoring of and incentives for climate-related targets
Plans and targets for climate-related issues were set in the Sustainability Action Plan through fiscal 2023, and their progress was managed by the former Sustainability Committee. However, from fiscal 2024 onward, progress will be managed by the Sustainability Management Committee and monitored by the Board of Directors within the framework of the four-year business plan.
Additionally, the executive renumeration system for internal directors has been revised as of fiscal 2024, and for the payment criteria for performance-linked renumeration, the grade will be calculated by also considering climate-related evaluation indicators. Included in the criteria for grade calculation is, regarding bonuses, the progress of CO2 emissions reduction targets, and regarding the Board Benefit Trust (BBT), evaluations by external ESG rating agencies (MSCI, FTSE, CDP) and the achievement of CO2 emissions reduction targets.
Climate-related agenda items at the Board of Directors and other meetings (FY2025)
| Sustainability Promotion Committee (held three times) |
|---|
|
Strategy
1. Identifying climate-related risks and opportunities
Primary factors related to climate change
Factors related to climate change that could impact our business operations encompass several key aspects, including increasingly stringent regulations aimed at fostering a decarbonized society, advancements in technology geared toward a low-carbon future, market shifts driven by responses to climate change, and the growing frequency of climate-induced disasters and events. Based on the nature of the Group’s business operations, we have identified the climate-related transition risks, physical risks, and opportunities associated with each of these factors.
Primary factors impacting Daifuku’s business operations
Please enlarge the screen to view
Assessment of climate-related risks and opportunities
We have assessed the level of impact, both qualitative and quantitative, on the Group’s business for each identified transition risk, physical risk, and opportunity. These results have been categorized based on factors such as time period until risk manifestation or opportunity realization, likelihood of risk manifestation or opportunity realization, and financial impact, as shown below. In response to our assessment, we are implementing appropriate countermeasures for each risk and opportunity.
The definitions for time period, likelihood, and impact are as shown in the chart below.
| Time period | Short term: less than 3 years; medium term: 3 to 10 years; long term: more than 10 years |
|---|---|
| Likelihood | Low: somewhat uncertain; medium: intermediate; high: somewhat certain |
| Impact | Sales Small: less than 6 billion yen; medium: 6 to 60 billion yen; large: more than 60 billion yen Profit and cost Small: less than 600 million yen; medium: 600 million to 6 billion yen; large: more than 6 billion yen |
Significant risks and opportunities for the Group
- *Scroll horizontally to view
| Category | Climate change drivers | Major risks and opportunities | Time period | Likelihood | Impact | Main responses to risks and opportunities | |
|---|---|---|---|---|---|---|---|
| Transition risks (1.5°C scenario) |
Policy regulations | Tighter GHG emissions regulations, introduction of carbon pricing | Increase in operating costs due to the introduction of a carbon tax on GHG emissions from factories and business sites |
Long term | High | Medium | ① Group-wide Scope 1 and Scope 2 reductions |
| Increase in procurement costs due to the introduction of a carbon tax or GHG reduction measures for material procurement and transport |
Long term | Medium | Medium | ② Reduction of environmental impact in the supply chain | |||
| Market | Progress in decarbonization technology development | Increase in parts procurement costs due to higher demand for metal materials and rare metals |
Medium to long term | Low | Medium | ||
| Reputation | Increasing stringency in the evaluation of initiatives to address climate change issues, rising demand for information disclosure |
Decline in stock price due to deterioration of the company’s image and increase in financing costs due to exclusion from investment opportunities |
Long term | Low | Medium to large | ③ Enhancement of climate-related information disclosure | |
| Physical risks (4°C scenario) |
Acute | Increase and intensification of weather-related disasters such as floods, typhoons, and storm surges |
Site damage and operation stoppages, operation stoppages due to supply chain disruptions, and procurement of substitute parts |
Short to long term | High | Medium to large | ④ Risk assessments and implementation of risk mitigation measures |
| Chronic | Chronic rise in sea level | Relocation of sites due to rise in sea level | Long term | Low | Small | ||
| Heat waves and chronic temperature increases | Increased air conditioning costs and maintenance due to rising temperatures and reduced productivity due to heat stress |
Short to long term | High | Medium | ⑤ Maintenance and improvement of working environment | ||
| Increasing water risk due to droughts | Decreased capacity utilization due to droughts | Short to long term | Medium | Small | ⑥ Reduction of water use | ||
| Opportunities (1.5°C scenario) |
Products and services | Increasing demand for power savings in electronic equipment due to tighter environmental regulations |
Increase in sales of products for semiconductor lines due to higher demand for semiconductors |
Medium term | High | Medium | ⑦ Strategic response to semiconductor demand |
| Shift to EVs (spread of EVs and FCVs) | Increase in sales of our company’s products due to the expansion of automobile production lines accompanying the shift to EVs |
Medium to long term | Medium | Small | ⑧ Adaptation to the shift to EVs | ||
| Progress in low-carbon technologies using IoT | Increase in sales due to higher demand for AI and IoT-related products and cost reductions through their utilization |
Medium to long term | Medium | Medium | ⑨ Utilization of IoT, ICT, AI, and other advanced technologies in our business | ||
| Growing demand for waste reduction including food loss | Increase in sales of products for logistics and warehouse facilities related to cold chain |
Medium to long term | High | Medium | ⑩ Response to cold chain and e-commerce demand | ||
| Increasing demand for more efficient, labor-saving, and energy-saving work to achieve low operations to achieve low carbon emissions |
Increase in sales of products and services that contribute to more efficient and automated production and logistics |
Medium to long term | High | Medium | ⑪ Pursuit of environmental and social value in material handling systems | ||
Response to climate-related risks and opportunities
In response to the identified significant risks and opportunities, the Daifuku Group has established the Daifuku Environmental Vision 2050 and is pursuing the following initiatives based on our policy of realizing a world where material handling systems operate with zero environmental impact.
- ① Group-wide Scope 1 and Scope 2 reductions
- In fiscal 2023, the Group’s environmental targets for 2030 were revised to a higher standard, and the Group received validation from the Science Based Targets initiative (SBTi) for our CO2 emissions reduction targets. Scope 1 and Scope 2 are projected to reduce the Group’s overall CO2 emissions by 60% by 2030, with fiscal 2018 as the base year. We will systematically work toward this target by promoting capital investment focused on projects highly efficient in reducing CO2.
In our business operations, alongside fostering awareness of greenhouse gas (GHG) reduction within the Group through the implementation of an internal carbon pricing (ICP) system, we are actively advocating for energy visualization at our production sites and engaging in energy conservation initiatives to establish an energy monitoring and management system on a global scale. Specifically, we are systematically transitioning to LED lighting, enhancing the efficiency of air conditioners and compressors, and reassessing production facilities and methods. Additionally, we have set a target for the integration of renewable energy sources for 2030, and we are promoting the installation of new photovoltaic systems, the introduction of green power, and the purchasing of non-fossil fuel certificates at production sites both within and outside of Japan. - ② Reduction of environmental impact in the supply chain
- In accordance with our management philosophy and Group Code of Conduct, we have established a procurement policy for the Group. It includes the following statement on reducing environmental impact: “We will comply with laws, regulations, and agreements related to environmental conservation, and we will give priority to the procurement of products and services with a lower environmental impact. We will provide guidance and support to our business partners as needed, and we will address environmental issues such as climate change and biodiversity conservation throughout our supply chain.” In addition, the Daifuku Group established the Sustainable Procurement Guidelines in fiscal 2023 as a new standard for sustainable procurement activities. These guidelines are a complete revision of the CSR Procurement Standards established in fiscal 2017 with the aim of promoting further initiatives throughout the supply chain to resolve a wide range of social issues. In order to identify and mitigate risks in our supply chain, we plan to disseminate these guidelines to our business partners, verify their compliance, and conduct audits.
In addition, we launched the Supply Chain CO2 Reduction Program in fiscal 2023 as our own initiative to reduce CO2 emissions at our suppliers. This initiative requires major business partners in Japan to set CO2 emission reduction targets and to make efforts to reduce emissions. In 2025, we held an online briefing on CO2 reduction for 153 major business partners and continued to collect data on the amount of CO2 emissions from suppliers. Going forward, we will promote engagement activities with our major overseas business partners in the form of information sharing and reduction support, in order to achieve our 2030 targets. - ③ Enhancement of climate-related information disclosure
- We publish climate-related information mainly through our website and integrated report (Daifuku Report), and we engage in direct dialogue with investors and actively provide disclosures for rating agencies such as MSCI, FTSE, Sustainalytics, and CDP. In addition, we hold an IR Day once a year as a forum for dialogue with institutional investors regarding our growth strategy and other topics, and we provide opportunities for briefings that include sustainability-related information. Furthermore, the Group’s CO2 emissions results (in Scope 1, Scope 2, and some Scope 3 categories) are disclosed following third-party verification.
- ④ Risk assessments and implementation of risk mitigation measures
- We conduct risk assessments on a regular basis. We have identified natural disasters, including typhoons and floods, as severe risks that could have a significant impact on our business performance, and in order to improve the effectiveness of our business continuity plan (BCP), we are working to minimize the scale of damage in the event of a natural disaster. Furthermore, based on hazard maps prepared by local governments, we have confirmed the risk level of heavy rainfall and flooding at our major sites and are implementing wastewater treatment measures at our production sites. In Asia, where storms and floods are predicted to occur frequently, we are providing drainage pumps and sandbags, and purchasing insurance to cover damage caused by natural disasters, including floods.
- ⑤ Maintenance and improvement of working environment
- Under the direction of the Central Safety and Health Committee, each department and worksite has taken risks into consideration and installed high-efficiency air conditioners and spot coolers and provided workers with air-conditioned clothing. Additionally, in anticipation of reduced productivity due to deterioration of the working environment from rising temperatures, we are taking a variety of measures to prevent heat stroke at major production sites and customer facilities during installation and service work. To prevent temperature rises both inside and outside the buildings, we apply heat-shielding paint to roofs and walls, insulate roofs and walls with double-folded plates, and use urethane resin for flooring materials.
- ⑥ Reduction of water use
- In accordance with our 2030 target in the Daifuku Environmental Vision 2050 to reduce water consumption per sale unit by 60% compared to the fiscal 2018 level, we are striving to reduce water consumption at our production sites and offices. In fiscal 2022, we installed meters on the hydraulic equipment in the plant building with the highest water consumption at Shiga Works to visualize the amount of water used. Hydraulic equipment uses water for cooling, but it was found that a large amount of water was consumed even when the equipment was not in operation, so a temperature sensor was installed in the piping of the hydraulic tank, and a cooling system was introduced to cool the oil only when it is at a certain temperature. This initiative reduced the annual water consumption of the facility by approximately 45% compared to the previous fiscal year. We are also working on utilizing rainwater. Our new factory in China, built in 2023, has introduced a rainwater harvesting system, which has reduced our annual water intake by approximately 35% compared to the previous factory. We will continue to monitor the current situation at our other production facilities as well, and we will promote initiatives toward achieving our target.
- ⑦ Strategic response to semiconductor demand
- As demand for semiconductors increases, our customers, semiconductor manufacturers, are proactively making capital investments. Many of our material handling systems installed at semiconductor manufacturers operate 24 hours a day, 365 days a year, and their electricity consumption results in large CO2 emissions, so systems with high energy-saving capabilities are in high demand. We have set quantitative targets for the CO2 emissions associated with the operation of our products (Scope 3 Category 11) for 2030, and we are strengthening our development capabilities to ensure both product performance and energy-saving performance as well as collaborating with manufacturers to develop products. In China, where demand for semiconductors is expected to increase, we are enhancing our production system by building a new plant to produce products for semiconductors.
- ⑧ Adaptation to the shift to EVs
- We are committed to taking the environment into consideration from the product development stage as well as improving upon our existing environmentally friendly products. Our customers are facing changes in the business environment with the shift to EVs. The weight of materials to be transported on automobile production lines is increasing due to this shift, and the material handling systems that have already been delivered must be modified to accommodate this increase in transport weight. We are responding to our customers’ needs by developing material handling systems that are lighter, save space, and facilitate system modifications.
- ⑨ Utilization of IoT, ICT, AI, and other advanced technologies in our business
- Market requirements for IoT-related products are expected to change considerably as the introduction of AI and digital technologies in industrial equipment and devices accelerates. In addition, demand for industrial IoT-related products is expected to increase as the transition to a low-carbon society progresses through the use of IoT along with increased capital investment in the global manufacturing industry. In order to respond to these factors, we are working to strengthen the development of basic technologies and applied technologies such as AI as well as to build a production framework to meet growing demand. In addition, we are promoting the overall introduction and utilization of these advanced technologies across all of our business activities.
- ⑩ Response to cold chain and e-commerce demand
- Climate change is expected to increase demand for our products and services due to the growing demand for cold chain and e-commerce. At present, we are expanding our business in Asia and North America, and we are promoting the establishment and enhancement of production systems to meet future increases in demand.
- ⑪ Pursuit of environmental and social value in material handling systems
- Amid growing customer needs for more efficient operations and energy conservation at logistics and production sites, we are striving to balance the environmental and social value of our products. We conduct Life Cycle Assessments (LCAs) during product development in order to reduce CO2 emissions over the entire life cycle of our products in comparison to conventional products. In addition to this type of environmental value, we also conduct sustainability performance assessments that take into account social value resulting from the introduction of our products, such as increased operational efficiency and improved sorting and storage capacity, in order to visualize and enhance the value we provide.
2. Significant risk scenario analyses
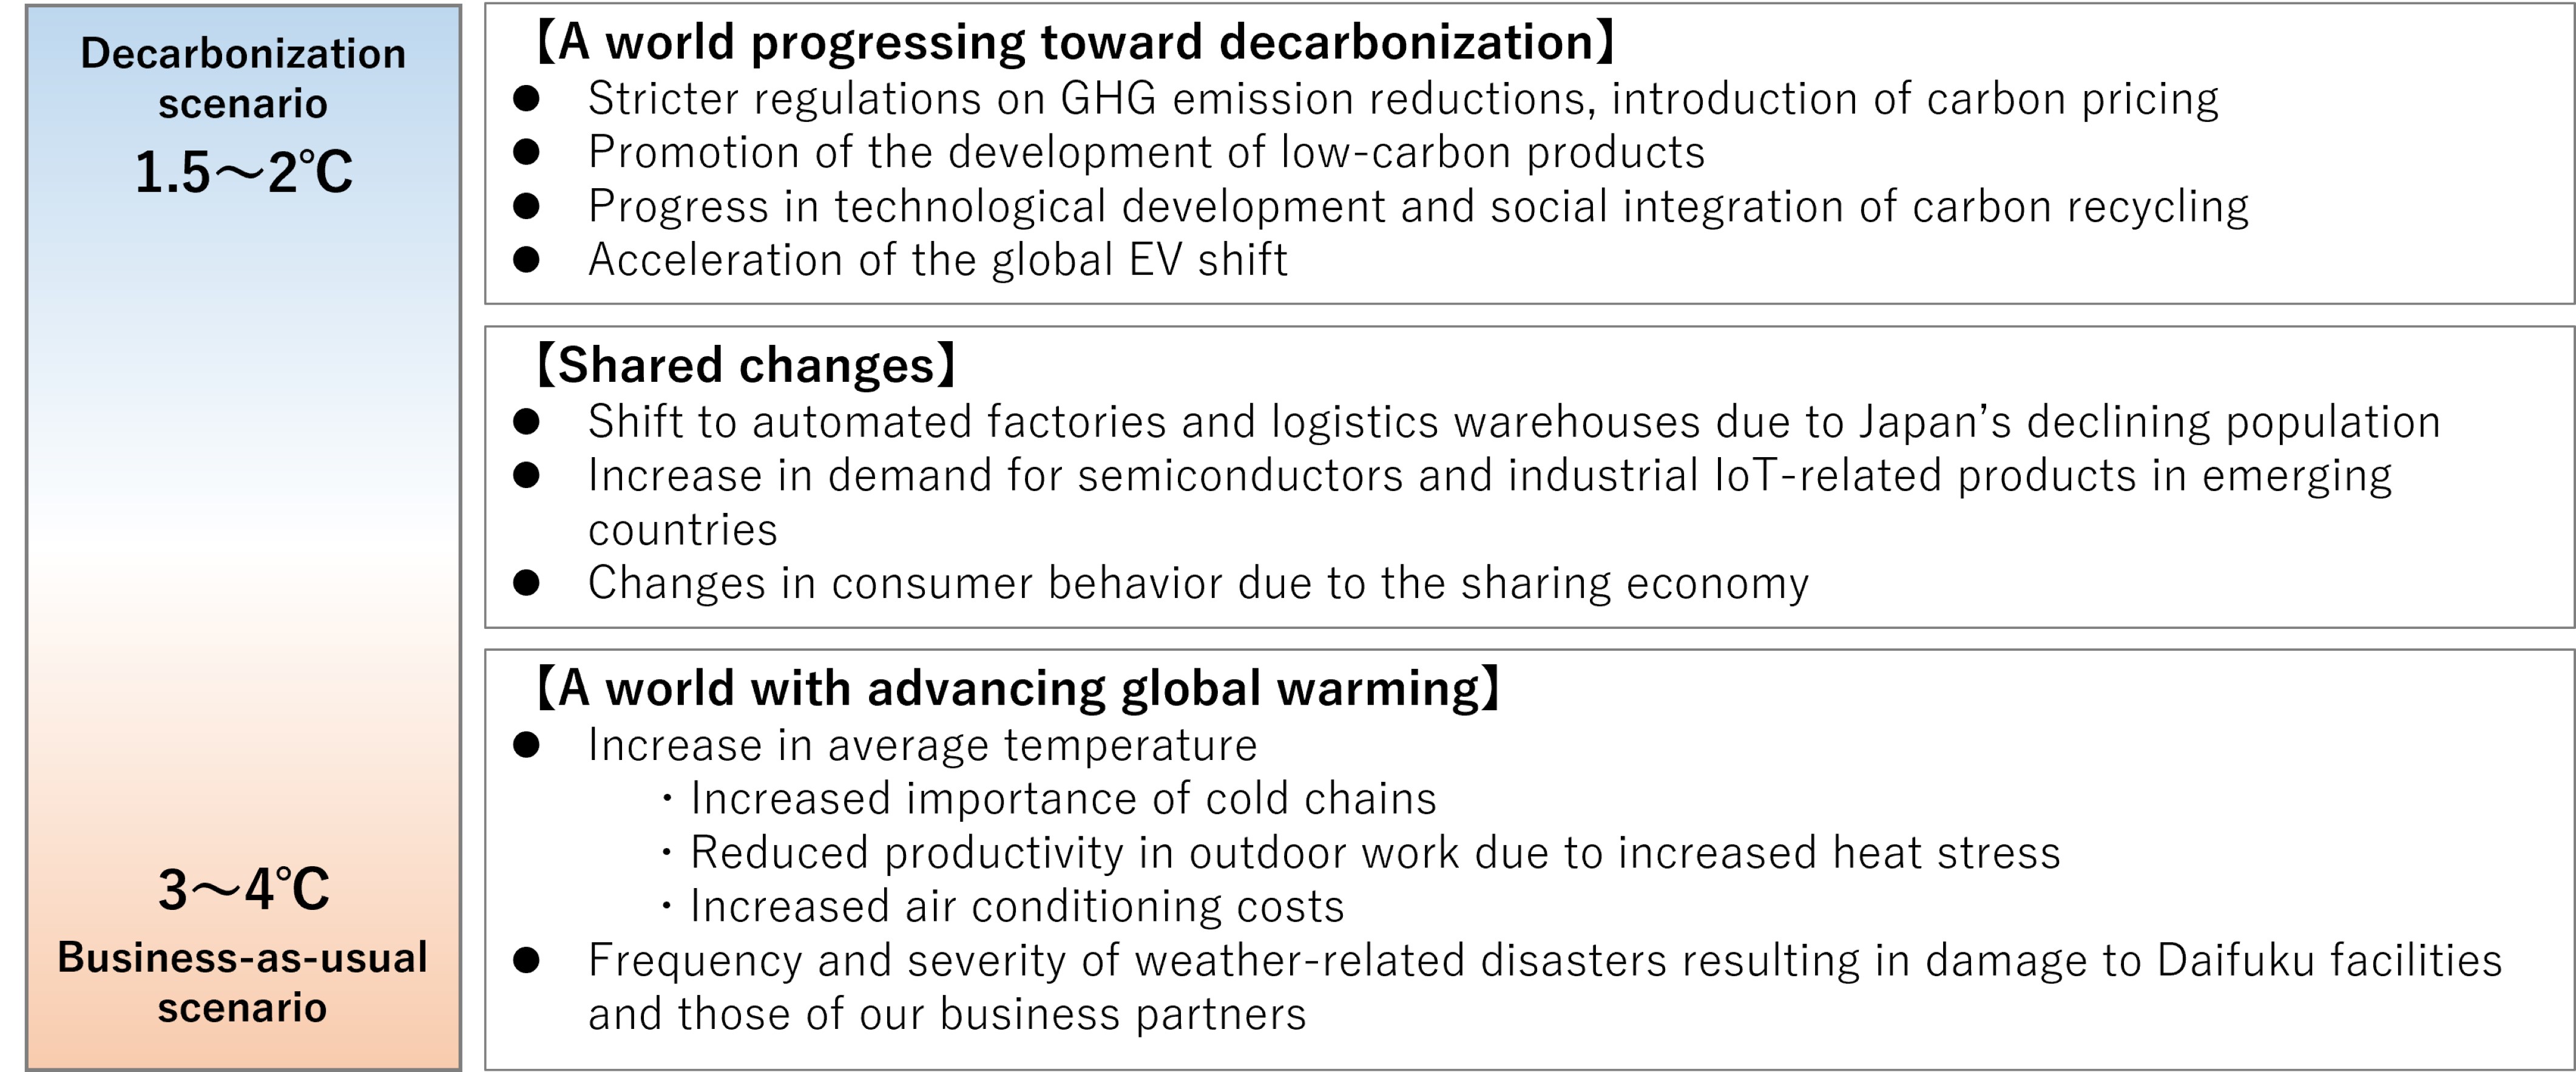
We conducted scenario analyses for identified climate-related risks and opportunities, focusing on those likely to manifest in the future and have a substantial impact on our business. These scenarios were modeled based on projections from the International Energy Agency (IEA) and the Intergovernmental Panel on Climate Change (IPCC).
Transition risks
We analyzed transition risks and opportunities by establishing the following scenarios to evaluate the effects of implementing a carbon tax (carbon pricing) on operating costs and associated energy expenses. The carbon tax was calculated using the projected future GHG (greenhouse gas) emissions (Scope 1 and Scope 2) both in the event that we progress with emissions reductions (decarbonization scenario) and in the event that we do not (business-as-usual scenario) based on the Group’s 2030 sales forecast and emissions reduction targets. For each scenario, the impact on our business was assessed by multiplying the estimated future GHG emissions by the carbon price projected by the IEA. As for energy costs, we examined energy consumption both in the event that the Group pursues initiatives in line with our reduction targets (decarbonization scenario) and in the event that the scale of our business expands without pursuing reductions (business-as-usual scenario). We evaluated future energy costs by referencing the estimated energy consumption for each scenario and the energy price trends provided by the IEA and other organizations.
Climate change scenarios projected by the Group (transition risk)
| Decarbonization scenario 1 (1.5°C scenario) | IEA WEO2023 NZE: Net Zero Emissions by 2050 Scenario |
|---|---|
| Decarbonization scenario 2 (1.7°C scenario) | IEA WEO2023 APS: Announced Pledges Scenario |
| Business-as-usual scenario (4°C scenario) | IEA WEO2023 STEPS: Stated Policies Scenario |
Carbon tax
In the business-as-usual scenario (4°C scenario), the cost increase is expected to be approximately 600 million yen by 2030. By contrast, under the decarbonization scenario (1.5°C and 1.7°C scenarios), in which decarbonization initiatives are actively promoted, the cost is expected to increase by about 300 million yen by 2030.
Energy cost
In the business-as-usual scenario (4°C scenario), costs are expected to increase by about 37% by 2030 compared to the fiscal 2022 level. However, under the decarbonization scenario (1.5°C and 1.7°C scenarios), in which decarbonization efforts are actively promoted, costs are expected to increase by about 12-16% by 2030 compared to the fiscal 2022 level.
In terms of both the carbon tax burden and energy costs, the burden in the business-as-usual scenario (4°C scenario) is greater than that of the decarbonization scenarios (1.5°C and 1.7°C scenarios), reaffirming that there are reasons and merits for the Daifuku Group to actively pursue decarbonization and energy conservation initiatives. While a major investment is required to move forward with these initiatives, we anticipate an additional burden of several hundred million yen if we do not pursue them. In order to mitigate the risks affecting our business, we will strengthen our decarbonization initiatives in order to achieve our 2030 reduction targets.
Physical risks
Physical risks have become significant due to the increase in weather-related disasters caused by global warming. We therefore conducted qualitative assessments of the impact of weather-related disasters on 24 of the Group’s major sites (1 in Japan and 23 in other countries). In these assessments, we investigated the hazards of floods, storm surges, droughts, and heat waves at each site under the 2°C scenario (SSP1-2.6) and 4°C scenario (SSP5-8.5) and assigned a five-point grade from A (high risk) to E (low risk) according to the degree of hazard. The following table shows the number of sites that were given a grade of A or B (high risk) in this assessment.
The results of the assessment show that the number of high-risk sites for floods, storm surges, and droughts do not increase substantially under either the 2°C or 4°C scenarios, indicating that the impact of climate change will be limited. For heat waves, the number of high-risk sites was found to increase in 2050 and 2090 under the 4°C scenario. The impacts of heat waves include increased air conditioning costs and equipment maintenance as well as decreased productivity due to heat stress. Daifuku will actively take steps to mitigate these risks, such as promoting measures to prevent heat stroke among employees at installation sites and plants.
Climate change scenarios projected by the Group (physical risks)
| 2°C scenario | IPCC Sixth Assessment Report (SSP1-2.6) |
|---|---|
| 4°C scenario | IPCC Sixth Assessment Report (SSP5-8.5) |
Number of high-risk sites due to climate change
| Disaster | Present | 2°C scenario (SSP1-2.6) | 4°C scenario (SSP5-8.5) | ||
|---|---|---|---|---|---|
| 2050 | 2090 | 2050 | 2090 | ||
| Floods | 0 | 0 | 0 | 0 | 1 |
| Storm surges | 1 | 1 | 1 | 1 | 2 |
| Droughts | 8 | 8 | 8 | 8 | 8 |
| Heat waves | 2 | 2 | 2 | 7 | 16 |
Risk Management
The Daifuku Group’s risk management system
The Daifuku Group conducts regular risk assessments of all its domestic and international subsidiaries in order to identify and evaluate critical risks that could have a significant impact on business activities. The Risk Management Committee carries out Group-wide management for critical risks, formulating countermeasures and developing and enhancing policies, regulations, and systems. Any risk information identified in risk assessments is reported to and shared with the Board of Directors and other conference units as necessary and is reflected in management strategies.
In the formulation of the four-year business plan for 2027 that began in fiscal 2024, the results of the risk assessment conducted in fiscal 2023 were used as one part of the input information in the materiality assessment. In this plan, the results of opportunity and risk analyses, trends of other companies, and requests from ESG rating agencies were also considered as input information, and potential topics were evaluated on two focal points: impact on stakeholders and impact on the achievement of our long-term vision. After obtaining validation from the Board of Directors, we established addressing climate change as one of the priority topics in this plan.
Management of climate-related risks and opportunities
The identification of climate-related risks and opportunities was reviewed in fiscal 2023 following the advice of external experts. We identify critical risks and opportunities by evaluating the timing and likeliness of occurrence as well as the level of impact on the Group, both qualitatively and quantitatively, for each transition risk, physical risk, and opportunity. In addition, a scenario analysis for transition and physical risks was performed based on multiple temperature increases (see the Strategy section for details). The Sustainability Management Committee, the Sustainability Promotion Committee, the Risk Management Committee, and the Group’s Human Resources Committee will coordinate as necessary to monitor and appropriately respond to sustainability-related risks and opportunities that must be prioritized.
Metrics and TargetsKPI
The Group has identified addressing climate change as one of the crucial issue areas in the Daifuku Environmental Vision 2050 and has set the following targets. The targets for 2030 have received official approval from the Science Based Targets initiative (SBTi)* and include a 1.5°C aligned target for Scope 1 and Scope 2 and a well-below 2°C aligned target for Scope 3 (Categories 1 and 11). From fiscal 2023 onward, the results will be disclosed based on these KPIs.
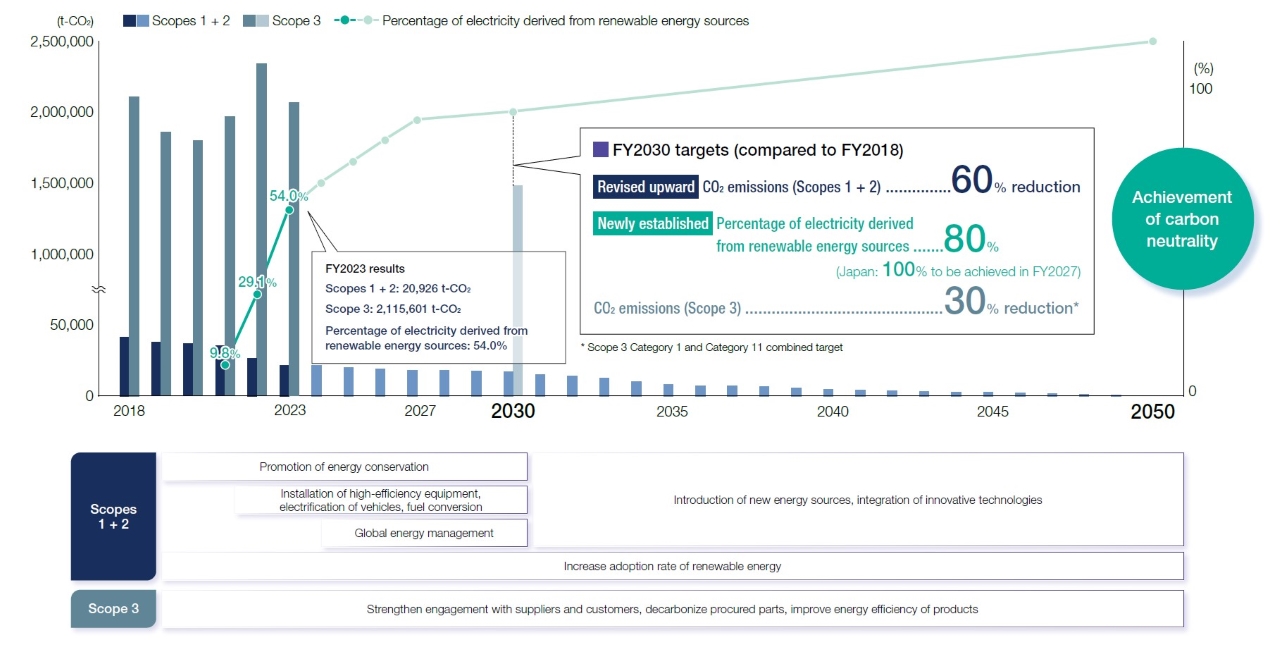
In May 2024, regarding one of our critical issue areas, addressing climate change, we have upwardly revised our 2030 Scope 1 and Scope 2 reduction targets (compared to FY2018) from 50.4% to 60%. In addition, we have set a new target for the percentage of electricity derived from renewable energy sources.
- *The Science Based Targets initiative (SBTi) is a collaboration between the CDP, the United Nations Global Compact, the World Resources Institute (WRI), and the World Wide Fund for Nature (WWF). Approval is awarded to companies that are recognized as having set science-based targets in alignment with the criteria established by the Paris Agreement.
| Key Performance Indicators (KPIs) | Scope | FY2025 targets | FY2025 results | FY2030 targets |
|---|---|---|---|---|
| Daifuku CO2 emissions reduction rate (compared to FY2018) (Scopes 1 + 2) |
Global | 52% | 56.4% | 60% |
| Percentage of electricity derived from renewable energy sources | 66% | 73.9% | 80% | |
| Reduction rate of CO2 emissions from purchased goods and services (Scope 3 Category 1) |
Expand and disseminate CO2 emissions reduction programs*1 throughout the supply chain | Held online briefings on CO2 reduction for 153 major domestic suppliers and continued to collect CO2 emission data from them | 30% reduction*2 (compared to FY2018) |
|
| Reduction rate of CO2 emissions from the use of sold products (Scope 3 Category 11) |
Improve energy-saving performance of products and systems | Implemented LCAs (Life Cycle Assessments) for all new product and system development |
- *1The Group’s own framework on efforts (sharing of goals and supporting measures to reduce emissions, etc.) to reduce CO2 emissions at suppliers
- *2Scope 3 Category 1 and Category 11 combined target
Roadmap toward carbon neutrality
Data on CO2 emissions
CO2 emissions by region
CO2 emissions (Scope 1 and Scope 2)
CO2 emissions (Scope 3)
- *The scope of aggregation has changed, so figures for previous years have been revised (May 2026).
Breakdown of Scope 3 emissions
(t-CO2)
| Category | FY2018 (base year) |
FY2019 | FY2020 | FY2021 | FY2022 | FY2023 | FY2024 | FY2025 |
|---|---|---|---|---|---|---|---|---|
| 1. Purchased goods and services | 1,080,234 | 1,147,335 | 1,159,954 | 1,329,868 | 1,569,767 | 1,330,496 | 1,423,005 | 1,568,245 |
| 2. Capital goods | 10,653 | 36,502 | 10,013 | 15,923 | 17,316 | 39,131 | 27,587 | 157,504 |
| 3. Fuel- and energy-related activities | 5,960 | 6,063 | 5,957 | 6,377 | 6,468 | 5,958 | 5,933 | 7,450 |
| 4. Upstream transportation and distribution | 17,554 | 23,850 | 23,631 | 26,832 | 44,077 | 29,261 | 41,474 | 27,630 |
| 5. Waste generated in operations | 532 | 517 | 527 | 565 | 604 | 618 | 632 | 673 |
| 6. Business travel | 542 | 568 | 576 | 588 | 601 | 610 | 608 | 992 |
| 7. Employee commuting | 1,484 | 1,546 | 1,585 | 1,614 | 1,638 | 1,658 | 1,667 | 2,811 |
| 8. Upstream leased assets | - | - | - | - | - | - | - | - |
| 9. Downstream transportation and distribution | - | - | - | - | - | - | - | - |
| 10. Processing of sold products | - | - | - | - | - | - | - | - |
| 11. Use of sold products | 1,001,816 | 604,900 | 587,708 | 575,839 | 719,207 | 704,991 | 702,486 | 574,694 |
| 12. End-of-life treatment of sold products | 2,830 | 3,083 | 3,058 | 3,134 | 3,666 | 2,878 | 2,363 | 2,114 |
| 13. Downstream leased assets | - | - | - | - | - | - | - | - |
| 14. Franchises | - | - | - | - | - | - | - | - |
| 15. Investments | - | - | - | - | - | - | - | - |
| Total | 2,121,605 | 1,824,364 | 1,793,009 | 1,960,740 | 2,363,344 | 2,115,601 | 2,205,756 | 2,342,113 |
- *The scope and method of calculation for Scope 3 is as follows.
| Category | Scope | Method of calculation |
|---|---|---|
| 1. Purchased goods and services | Global | Domestic data is calculated by multiplying the amount of products, materials, and services purchased by the CO2 emissions factor. Data from outside of Japan is calculated in proportion to domestic data based on actual production. |
| 2. Capital goods | Daifuku Co., Ltd. | Calculated by multiplying Daifuku’s increase in properties, plants, and equipment in the current period (excluding leased assets in the Annual Securities Report) by the CO2 emissions factor. |
| 3. Fuel- and energy-related activities | Global | Calculated by multiplying the Group’s energy consumption (Scope 1 and Scope 2) by the CO2 emissions factor. |
| 4. Upstream transportation and distribution | Global | Calculated based on CO2 emissions from Daifuku’s sales activities as well as transportation distance and weight of raw materials from primary suppliers (new ton-kilometer method). Data from outside of Japan is calculated in proportion to domestic data based on actual production. |
| 5. Waste generated in operations | Domestic Group | Calculated by multiplying the Group’s domestic waste emissions by the CO2 emissions factor for each type. |
| 6. Business travel | Domestic Group | Calculated by multiplying the number of domestic Group employees by the CO2 emissions factor. |
| 7. Employee commuting | Domestic Group | Calculated by multiplying the number of domestic Group employees in each district (city classification) by the CO2 emissions factor. |
| 8. Upstream leased assets | Not calculated due to lack of relevance to the Group’s business operations. | |
| 9. Downstream transportation and distribution | Although related to the Group’s business operations, emissions from transportation are accounted for in Category 4 as the Group is a consignor. | |
| 10. Processing of sold products | Not calculated due to lack of relevance to the Group’s business operations. | |
| 11. Use of sold products | Global | Calculated by multiplying the amount of energy used in the operation of products ordered from the domestic Group by the annual sales and product life. Data from outside of Japan is calculated in proportion to domestic data based on actual production. Emissions factors for each country to which the products are shipped are also taken into account. |
| 12. End-of-life treatment of sold products | Global | Calculated by multiplying the weight of products sold by Daifuku by the CO2 emissions factor. Data from outside of Japan is calculated in proportion to domestic data based on net sales. |
| 13. Downstream leased assets | Not calculated due to lack of relevance to the Group’s business operations. | |
| 14. Franchises | Not calculated due to lack of relevance to the Group’s business operations. | |
| 15. Investments | Not calculated due to lack of relevance to the Group’s business operations. | |
Major Initiatives
Initiatives for the introduction of renewable energy
We are working to introduce renewable energy at our Group locations both within and outside of Japan. In Japan, as of November 2022 at Shiga Works and November 2024 at all domestic locations, all electricity used has been converted to renewable energy sources. Outside of Japan, in fiscal 2025, we installed photovoltaic equipment at Daifuku Intralogistics India Private Limited (India), and introduced new renewable energy through an on-site PPA at Daifuku Korea Co., Ltd. (South Korea). In addition, Daifuku Automotive America Corporation (US) and Daifuku Oceania Limited (New Zealand) also switched to electricity derived from renewable energy sources. In fiscal 2026, we plan to introduce renewable energy in South Korea, Taiwan, and the United States.
Status and schedule of renewable energy procurement
- FY2024
-
- Installed a photovoltaic system at Hallim Machinery Co., Ltd.
- Switched to a renewable energy electricity plan at Daifuku Europe GmbH
- Switched to a renewable energy electricity plan at Daifuku Airport America Corporation's Louisville plant
- FY2025
-
- Install a photovoltaic system at Daifuku Intralogistics India Private Limited
- Procure renewable energy certificates for all of our factories and offices in China
- Daifuku (China) Co., Ltd.
- Daifuku (China) Automation Co., Ltd.
- Daifuku (Suzhou) Cleanroom Automation Co., Ltd.
- Daifuku (China) Manufacturing Co., Ltd.
- Sign an on-site PPA contract at Daifuku Korea Co., Ltd.
- Switch to a renewable energy plan at Daifuku Automotive America Corporation
- Switched to a renewable energy electricity plan at Daifuku Oceania Limited
- FY2026 (planned)
-
- Sign an on-site PPA contract at Clean Factomation, Inc. and Hallim Machinery Co., Ltd.
- Install a solar battery storage system at Taiwan Daifuku Co., Ltd.
- Procure renewable energy certificates for Daifuku Airport America Corporation
Daifuku Mega Solar
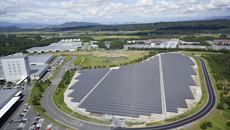
In November 2013, Daifuku installed a photovoltaic system, Daifuku Mega Solar, at Shiga Works. Comprised of 17,752 panels, the system has a maximum power generation capacity of 4,438 kW and an annual output of approximately 4,860,000 kWh (equivalent to the annual power consumption of 1,000 general households).
Use of internal carbon pricing (ICP)
The Daifuku Group introduced the ICP system in 2024 with the aim of fostering and raising employee awareness of energy conservation and decarbonization. The Group anticipates risks such as rising carbon prices as society moves toward decarbonization, and has adopted the IEA World Energy Outlook 2023's projected carbon price for 2030 as an ICP price, setting it at US$140 (¥21,000)/t-CO2. We currently apply ICP to CO2emissions and reductions and use this information in our internal reports. We also use ICP as one of the reference indicators when deciding whether or not to proceed with large-scale investments in our group-wide investment management regulations, which came into effect in August 2025. Going forward, we will continue to use the ICP system to raise employees' awareness of decarbonization and transform their decision-making processes, thereby promoting sustainable decarbonization efforts.
Sharing transportation resources
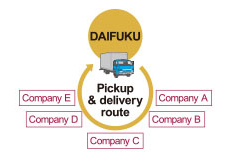
to suppliers in a given region
(milk run method*)
We are now building a partnership with suppliers for parts and materials and set up a pickup and delivery service in order to reduce costs and properly control delivery dates. While suppliers had previously transported cargo with their own trucks, by centrally managing cargo collection and quantity information, we are now able to make rounds with a single truck in each region, and we are striving to further consolidate and streamline trips to logistics sites. We are contributing to the prevention of global warming by reducing CO2 emissions throughout the entire supply chain as well as reducing each supplier’s logistics costs.
- *Milk run method: One truck makes the rounds to each supplier and picks up cargo that had previously been delivered by separate trucks. This method improves load efficiency and reduces fuel consumption and CO2 emissions.
Modal shift*
Daifuku typically uses trucks to transport products to customer sites, but we are in the process of shifting to more environmentally friendly methods such as railway and marine transportation. Our aim is to improve the quality of logistics operations by coordinating delivery schedules and managing costs, thereby reducing CO2 emissions as much as possible. In fiscal 2025, we were able to cut CO2 emissions by 515 tons through the modal shift of transportation methods.
- * Choosing modes of transportation with lower environmental impact, such as railroads and ships, to transport cargo. By switching from trucks to ships and trains, it is possible to transport cargo with reduced CO2 emissions and less impact on the environment.
Participation in Climate-Related Initiatives
To fully realize the Daifuku Environmental Vision 2050, the Daifuku Group has joined multiple initiatives aiming to solve climate change issues and is involved in information sharing and policy proposals.
Participating initiatives
- Science Based Targets initiative
- Japan Climate Initiative
- Japan Climate Leader’s Partnership (supporting member)
- TCFD Consortium
- GX League