Financial and Non-Financial Highlights
| Million yen | % | ||
| FY2016 | FY2015 | Change | |
| For the Year | |||
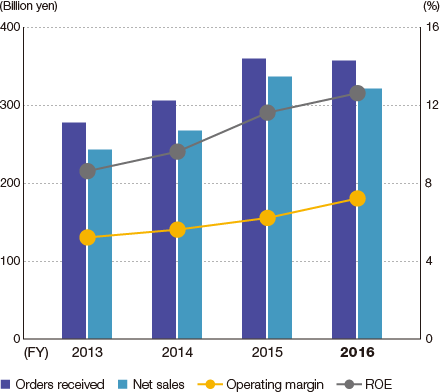
| Orders received | ¥356,518 | ¥359,427 | (0.8)% |
| Net sales | 320,825 | 336,184 | (4.6) |
| Operating income | 23,099 | 20,878 | 10.6 |
| Net income attributable to shareholders of the parent company |
16,746 | 13,652 | 22.7 |
| Capital investment | 5,905 | 4,210 | 40.3 |
| R&D expenditures | 7,489 | 7,009 | 6.8 |
| Cash Flows | |||
| Cash flows from operating activities | ¥ 26,683 | ¥ 7,206 | 270.3% |
| Cash flows from investing activities | (5,393) | (2,099) | (156.9) |
| Free cash flows | 21,289 | 5,107 | 316.8 |
| Cash flows from financial activities | (4,404) | (8,702) | 49.4 |
| At Year-End | |||
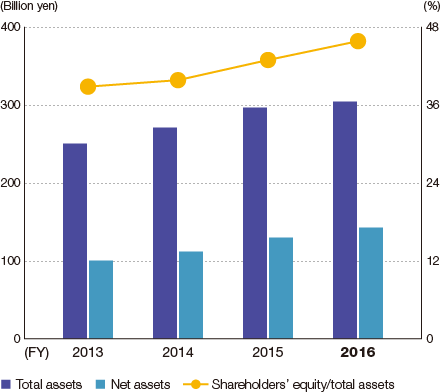
| Total assets | ¥303,540 | ¥296,055 | 2.5% |
| Working capital | 96,401 | 99,293 | (2.9) |
| Net assets | 142,340 | 130,116 | 9.4 |
| Amounts per Share of Common Stock | |||
| Net income per share (Yen) | ¥137.58 | ¥ 118.72 | 15.9% |
| Net assets per share (Yen) | 1,142.14 | 1044.40 | 9.4 |
| Cash dividends per share (Yen) | 42 | 30.00 | 40.0 |
| Ratios | |||
| Operating income/net sales | 7.20% | 6.2% | +1.0pt |
| Net income/net sales | 5.2 | 4.1 | +1.1pt |
| Return on shareholders’ equity (ROE) | 12.6 | 11.6 | +1.0pt |
| Shareholders’ equity/total assets | 45.8 | 42.9 | +2.9pt |
Note: A PDF version containing notes to the financial statements is available on our website: www.daifuku.com/ir/library/annualreport
| Million yen | % | ||
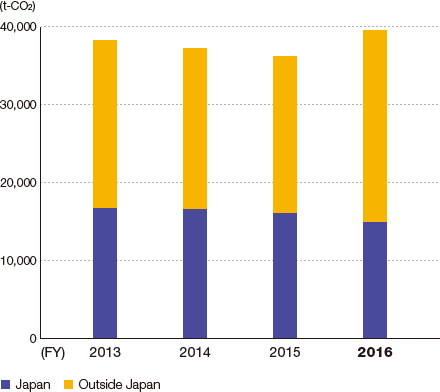
| Environment | FY2016 | FY2015 | Change |
| CO2 emissions (t-CO2) | |||
| Japan | 15,034 | 16,190 | (7.1)% |
| Outside Japan | 24,563 | 20,148 | 21.9 |
| CO2 reduction contribution from environmentally friendly products (t-CO2) | 41,689 | 33,367 | 24.9 |
| Water usage (m3) | |||
| Japan | 125,991 | 135,519 | (7.0) |
| Outside Japan | 102,160 | 98,522 | 3.7 |
| Emission and transfer volume of chemical substances related to PRTR Law (kg)*1 | 21,180 | 30,010 | (29.4) |
| Waste generated (t)*2 | 4,634 | 5,073 | (8.7) |
| Recycling rate (%)*2 | 98.7 | 98.3 | +0.4pt |
*1: Shiga Works
*2: Figures for Japan only
| Million yen | % | ||
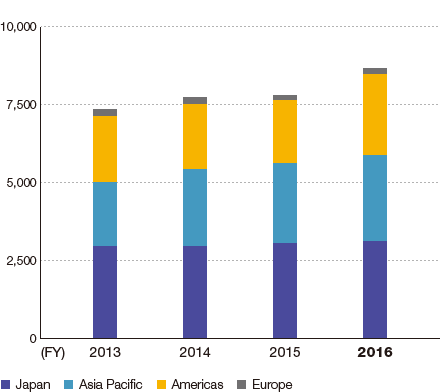
| Employees | FY2016 | FY2015 | Change |
| Total | 8,689 | 7,835 | 10.90% |
| Japan | 3,153 | 3,077 | 2.5 |
| Asia Pacific | 2,758 | 2,558 | 7.8 |
| Americas | 2,587 | 2,027 | 27.6 |
| Europe | 191 | 173 | 10.4 |