Financial and Non-Financial Highlights
| Million yen | % | U.S. thousand dollars |
||
| FY2015 | FY2014 | Change | FY2015 | |
| For the Year | ||||
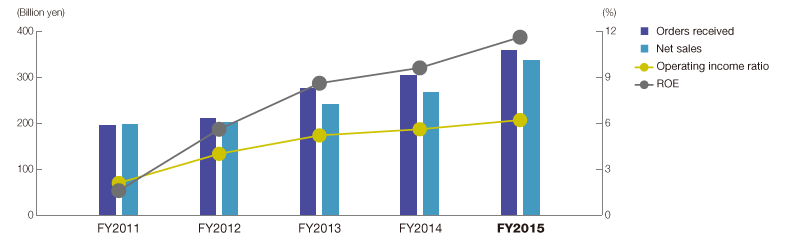
| Orders received | ¥359,427 | ¥305,567 | 17.6% | $3,189,520 |
| Net sales | 336,184 | 267,284 | 25.8 | 2,983,265 |
| Operating income | 20,878 | 14,883 | 40.3 | 185,275 |
| Net income attributable to shareholders of the parent company |
13,652 | 9,810 | 39.2 | 121,152 |
| Capital investment | 4,210 | 7,532 | (44.1) | 37,364 |
| R&D expenditures | 7,009 | 6,945 | 0.9 | 62,199 |
| Cash Flows | ||||
| Cash flows from operating activity | ¥ 7,206 | ¥ 6,295 | 14.5% | $ 63,952 |
| Cash flows from investing activity | (2,099) | (5,846) | 64.1 | (18,628) |
| Free cash flows | 5,107 | 448 | 1,038.6 | 45,323 |
| Cash flows from financial activity | (8,702) | (509) | (1,609.0) | (77,224) |
| At Year-End | ||||
| Total assets | ¥296,055 | ¥271,011 | 9.2% | $2,627,167 |
| Working capital | 99,293 | 91,187 | 8.9 | 881,117 |
| Net assets | 130,116 | 111,521 | 16.7 | 1,154,642 |
| Amounts per Share of Common Stock | ||||
| Net income per share (Yen and U.S. dollars) | ¥ 118.72 | ¥ 88.59 | 34.0% | $ 1.05 |
| Net assets per share (Yen and U.S. dollars) | 1044.40 | 972.75 | 7.4 | 9.26 |
| Cash dividends per share (Yen and U.S. dollars) | 30.00 | 22.00 | 36.4 | 0.26 |
| Ratios | ||||
| Operating income/net sales | 6.2% | 5.6% | +0.6pt | |
| Net income/net sales | 4.1 | 3.7 | +0.4pt | |
| Return on shareholders’ equity (ROE) | 11.6 | 9.6 | +2.0pt | |
| Shareholders’ equity/total assets | 42.9 | 39.8 | +3.1pt | |
| Notes: 1. | Details are described in "Financial Section." |
|---|---|
| 2. | The U.S. dollar amounts in this annual report are translated from Japanese yen for convenience only, at the rate of ¥112.69 = U.S.$1.00, on the Tokyo Foreign Exchange Market on March 31, 2016. |
| 3. | The amount of “Capital investment” in FY2014 includes goodwill generated from acquisition of shares in overseas companies. |
| Million yen | % | ||
| FY2015 | FY2014 | Change | |
| Employees | 7,835 | 7,746 | 1.1% |
| Water usage (m3)* | 135,519 | 136,801 | -0.9 |
| Emission and transfer volume of chemical substances related to PRTR Law (kg)* | 32,133 | 21,218 | 51.4 |
| Waste generated (t)* | 5,073 | 4,020 | 26.1 |
| Recycling rate (%)* | 98.3 | 99.2 | -0.9pt |
* Figures for Japan only