Financial Highlights
| Million yen | % | U.S. thousand dollars |
||
| FY2014 | FY2013 | Change | FY2014 | |
| For the Year | ||||
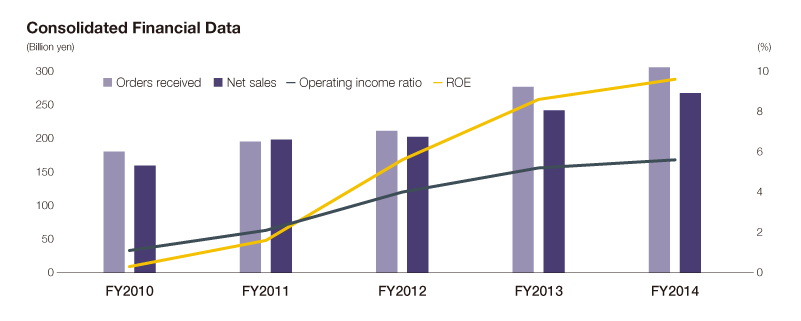
| Orders received | ¥305,567 | ¥276,831 | 10.4% | $2,540,683 |
| Net sales | 267,284 | 241,811 | 10.5 | 2,222,366 |
| Operating income | 14,883 | 12,556 | 18.5 | 123,750 |
| Net income | 9,810 | 7,740 | 26.7 | 81,572 |
| Capital investment | 7,532 | 10,446 | 27.9 | 62,632 |
| R&D expenditures | 6,945 | 7,490 | (7.3) | 57,749 |
| Cash Flows | ||||
| Cash flows from operating activities | ¥ 6,295 | ¥ 20,447 | (69.2)% | $ 52,345 |
| Cash flows from investing activities | (5,846) | (7,372) | 20.7 | (48,615) |
| Free cash flows | 448 | 13,074 | (96.6) | 3,729 |
| Cash flows from financing activities | (509) | 1,045 | (148.7) | (4,233) |
| At Year-End | ||||
| Total assets | ¥271,011 | ¥249,531 | 8.6% | $2,253,363 |
| Working capital | 91,187 | 87,070 | 4.7 | 758,192 |
| Net assets | 111,521 | 99,690 | 11.9 | 927,261 |
| Number of employees | 7,746 | 7,349 | 5.4 | |
| Amounts per Share of Common Stock | ||||
| Net income per share (Yen and U.S. dollars) | ¥ 88.59 | ¥ 69.96 | 26.6% | $ 0.73 |
| Net assets per share (Yen and U.S. dollars) | 972.75 | 875.14 | 11.2 | 8.08 |
| Cash dividends per share (Yen and U.S. dollars) | 22.00 | 18.00 | 22.2 | 0.18 |
| Ratios | ||||
| Operating income/net sales | 5.6% | 5.2% | +0.4pt | |
| Net income/net sales | 3.7 | 3.2 | +0.5pt | |
| Return on shareholders’ equity (ROE) | 9.6 | 8.6 | +1.0pt | |
| Shareholders’ equity/total assets | 39.8 | 38.8 | +1.0pt | |
Notes: 1. Details are described in “Financial Section”.
2. The U.S. dollar amounts in this annual report are translated from Japanese yen for convenience only, at the rate of ¥120.27=U.S.$1.00, on the Tokyo Foreign Exchange Market on
March 31, 2015.