


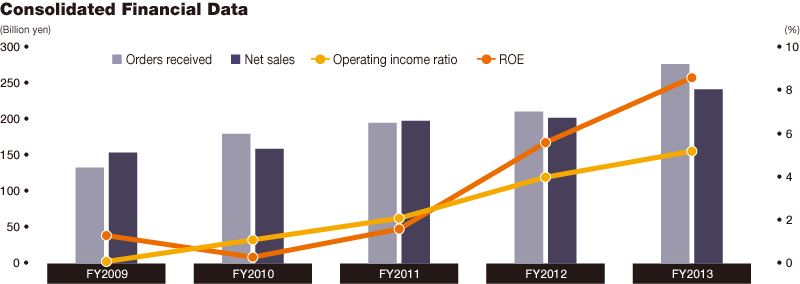
Financial Highlights
| Million yen | % | U.S. thousand dollars |
||
| FY2013 | FY2012 | Change | FY2013 | |
| For the Year | ||||
| Orders received | ¥276,831 | ¥210,990 | 31.2% | $2,689,772 |
| Net sales | 241,811 | 202,337 | 19.5 | 2,349,507 |
| Operating income | 12,556 | 8,010 | 56.8 | 122,006 |
| Net income | 7,740 | 4,439 | 74.4 | 75,209 |
| Net income per share (Yen and U.S. dollars) | 69.96 | 40.12 | 74.4 | 0.67 |
| Cash dividends per share (Yen and U.S. dollars) | 18.00 | 15.00 | 20.0 | 0.17 |
| Capital investment | 10,446 | 7,687 | 35.9 | 101,505 |
| R&D expenditures | 7,490 | 6,855 | 9.3 | 72,781 |
| At Year-End | ||||
| Total assets | ¥249,531 | ¥206,875 | 20.6% | $2,424,517 |
| Working capital | 87,070 | 45,832 | 90.0 | 846,002 |
| Net assets | 99,690 | 85,685 | 16.3 | 968,619 |
| Number of employees | 7,349 | 6,678 | 10.0 | |
| Ratios | ||||
| Operating income/net sales | 5.20% | 4.00% | +1.2pt | |
| Net income/net sales | 3.2 | 2.2 | +1.0pt | |
| Return on shareholders’ equity (ROE) | 8.6 | 5.6 | +3.0pt | |
| Shareholders’ equity/total assets | 38.8 | 40.4 | -1.6pt | |
Notes: 1. Details are described in “Financial Section” from page 21.
2. The U.S. dollar amounts in this annual report are translated from Japanese yen for convenience only, at the rate of ¥102.92=U.S.$1.00,
on the Tokyo Foreign Exchange Market on March 31, 2014.
![]()


